Show the packages used in this document
library(tidyverse)
library(knitr)
library(mediocrethemes)
library(here)
library(retrodesign)
library(haven)
library(DT)
library(kableExtra)

set_mediocre_all(pal = "coty")
Setting and data
Camerer et al. (2016) replicate 18 experimental economics studies published in the American Economic Review and the Quarterly Journal of Economics between 2011 and 2014. They find that original studies on average overestimate the replicated effect by a factor of 1.5 and only 61% of the replication find a significant effect in the same direction as the original study.
In this document, I report and replicate their results and further explore exaggeration in the original studies. This data allows to have a convincing estimate of the true effect (the replicated point estimate) and to evaluate the ability of the original design to accurately capture this estimate.
I retrieve the data from the project website. I just ran their Stata script create_studydetails.do to generate their data set. Since the standard errors of the estimates are not reported in this data set, I recompute them based on a normal distribution.
Show code
data_camerer_raw <- read_dta("Inputs/studydetails.dta")

data_camerer <- data_camerer_raw |>
  mutate(
    se_orig = (eorigu95 - eorig)/qnorm(0.975),
    se_rep = (erepu95 - erep)/qnorm(0.975),
  ) |>
  select(
    study,
    p_value_orig = porig,
    p_value_rep = prep,
    se_orig,
    se_rep,
    estimate_orig = eorig,
    estimate_rep = erep
  ) |>
  mutate(
    ratio = abs(estimate_orig/estimate_rep),
    same_sign_signif =
      (sign(estimate_orig) == sign(estimate_rep)
             & p_value_rep < 0.05)
  )
Replicability and Ratio Origingal/Replicated Estimate
I first reproduce the results in Camerer et al. (2016), evaluating the proportion of studies that find results in the same direction as the original study. I also compute the median ratio of the original over the replicated estimate.
Show code
data_camerer |>
  mutate(same_sign_and_signif = ifelse(same_sign_signif, "Yes", "No")) |>
  group_by(same_sign_and_signif) %>%
  summarise(
    number = n(),
    proportion = n()/nrow(.),
    `median_ratio_orig/rep` = median(ratio),
    `3rd_quartile_ratio_orig/rep` = quantile(ratio, 0.75)
  ) |>
  rename_with(\(x) str_to_title(str_replace_all(x, "_", " "))) |>
kable(digits = 2) | Same Sign And Signif | Number | Proportion | Median Ratio Orig/Rep | 3rd Quartile Ratio Orig/Rep |
|---|---|---|---|---|
| No | 7 | 0.39 | 2.36 | 5.76 |
| Yes | 11 | 0.61 | 1.09 | 1.38 |
The ratios of the original over the replicated estimate do not seem to be too large for studies that replicate but are more concerning for those that do not replicate:
Show code
data_camerer |>
  # filter(same_sign_and_signif) |>
  arrange(desc(ratio)) |>
  mutate(
    same_sign = ifelse(sign(estimate_orig) == sign(estimate_rep), "✓", " "),
    signif_rep = ifelse(p_value_rep < 0.05, "✓", " "),
    signif_orig = ifelse(p_value_orig < 0.05, "✓", " ")
  ) |>
  select(
    study_id = study,
    `ratio_orig/rep` = ratio,
    same_sign,
    signif_rep,
    signif_orig
  ) |>
  rename_with(\(x) str_to_title(str_replace_all(x, "_", " "))) |>
kable(digits = 2, align = "c") | Study Id | Ratio Orig/Rep | Same Sign | Signif Rep | Signif Orig |
|---|---|---|---|---|
| 13 | 40.21 | ✓ | ||
| 7 | 6.57 | ✓ | ||
| 5 | 4.95 | ✓ | ✓ | |
| 17 | 2.36 | |||
| 1 | 2.31 | ✓ | ✓ | |
| 12 | 2.26 | ✓ | ✓ | |
| 18 | 1.73 | ✓ | ✓ | |
| 10 | 1.47 | ✓ | ✓ | ✓ |
| 9 | 1.46 | ✓ | ✓ | ✓ |
| 14 | 1.41 | ✓ | ✓ | ✓ |
| 2 | 1.35 | ✓ | ✓ | |
| 15 | 1.25 | ✓ | ✓ | ✓ |
| 3 | 1.09 | ✓ | ✓ | ✓ |
| 16 | 1.06 | ✓ | ✓ | ✓ |
| 4 | 1.06 | ✓ | ✓ | ✓ |
| 8 | 0.99 | ✓ | ✓ | ✓ |
| 11 | 0.93 | ✓ | ✓ | ✓ |
| 6 | 0.44 | ✓ | ✓ | ✓ |
Power Calculations
Power and Exaggeration
I then compute the statistical power and exaggeration of the initial analysis. To do so, I assume that the true effect is equal to the effect found in the replication and compute the corresponding statistical power and exaggeration of the original study using the retrodesign package.
retro_camerer <- data_camerer |>
  mutate(
    retro = map2(estimate_rep, se_orig, \(x, y) retro_design_closed_form(x, y))
    #retro_design returns a list with power, type_s, type_m
  ) |>
  unnest_wider(retro) |>
  mutate(power = power * 100, type_s = type_s * 100)
For most studies, power and exaggeration are limited but some of them display limitations:
Show code
source(here("functions.R"))

retro_camerer |>
  summary_power() |>
  rename_with(\(x) str_to_title(str_replace_all(x, "_", " "))) |>
kable()| Median Exagg | 3rd Quartile Exagg | Prop Larger 2 | Median Power | 3rd Quartile Power |
|---|---|---|---|---|
| 1 | 1.8 | 22.2 | 93 | 100 |
Plotting the whole distribution of exaggeration ratio and power clarifies this heterogeneity:
Show code
retro_camerer |>
  filter(p_value_orig < 0.05) |>
  ggplot() +
  geom_dotplot(aes(x = type_m), color = NA) +
  labs(
    title = "Distribution of the exaggeration ratio in the original studies",
    subtitle = "If the true effect was equal to the replicated one",
    x = "Exaggeration ratio (log scale)",
    y = "Number of studies",
    caption = "Each dot represents one study"
  ) +
  scale_x_log10() +
scale_y_continuous(NULL, breaks = NULL) 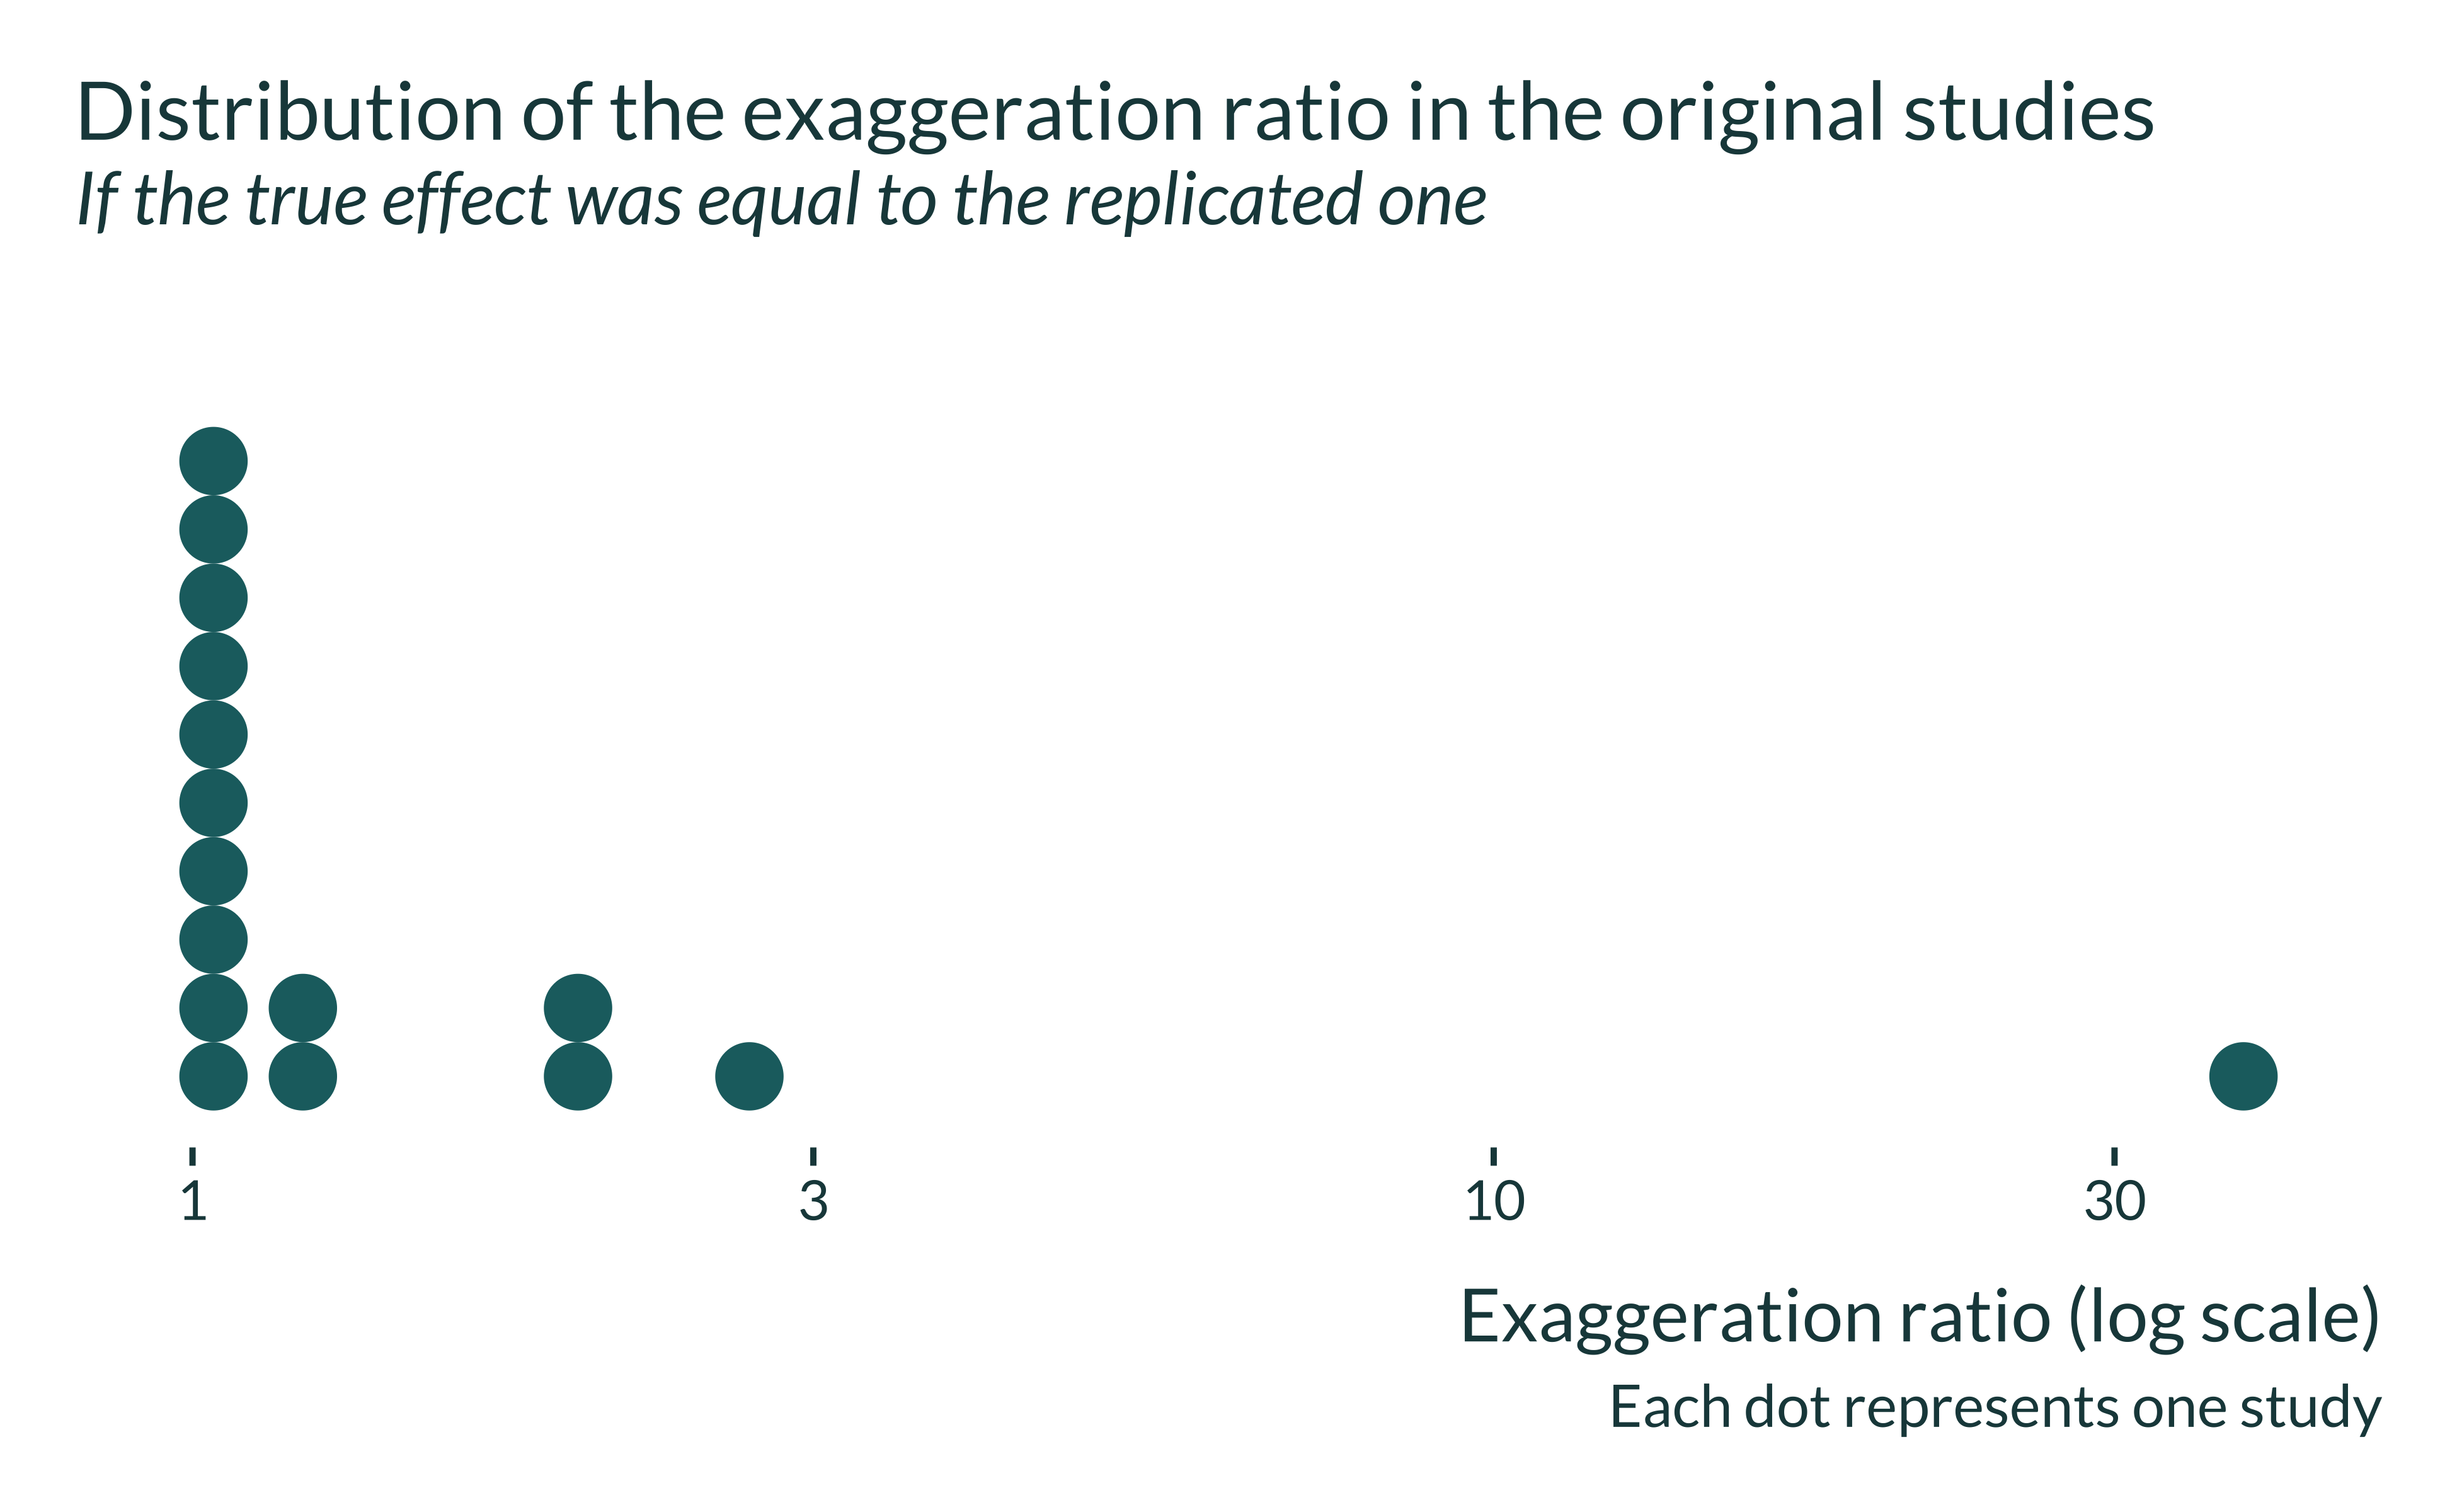
Show code
retro_camerer |>
  ggplot() +
  geom_dotplot(aes(x = power), color = NA) +
  labs(
    title = "Distribution of the power in the original studies",
    subtitle = "If the true effect was equal to the replicated one",
    x = "Power (%)",
    y = "Number of studies",
    caption = "Each dot represents one study"
  ) +
scale_y_continuous(NULL, breaks = NULL) 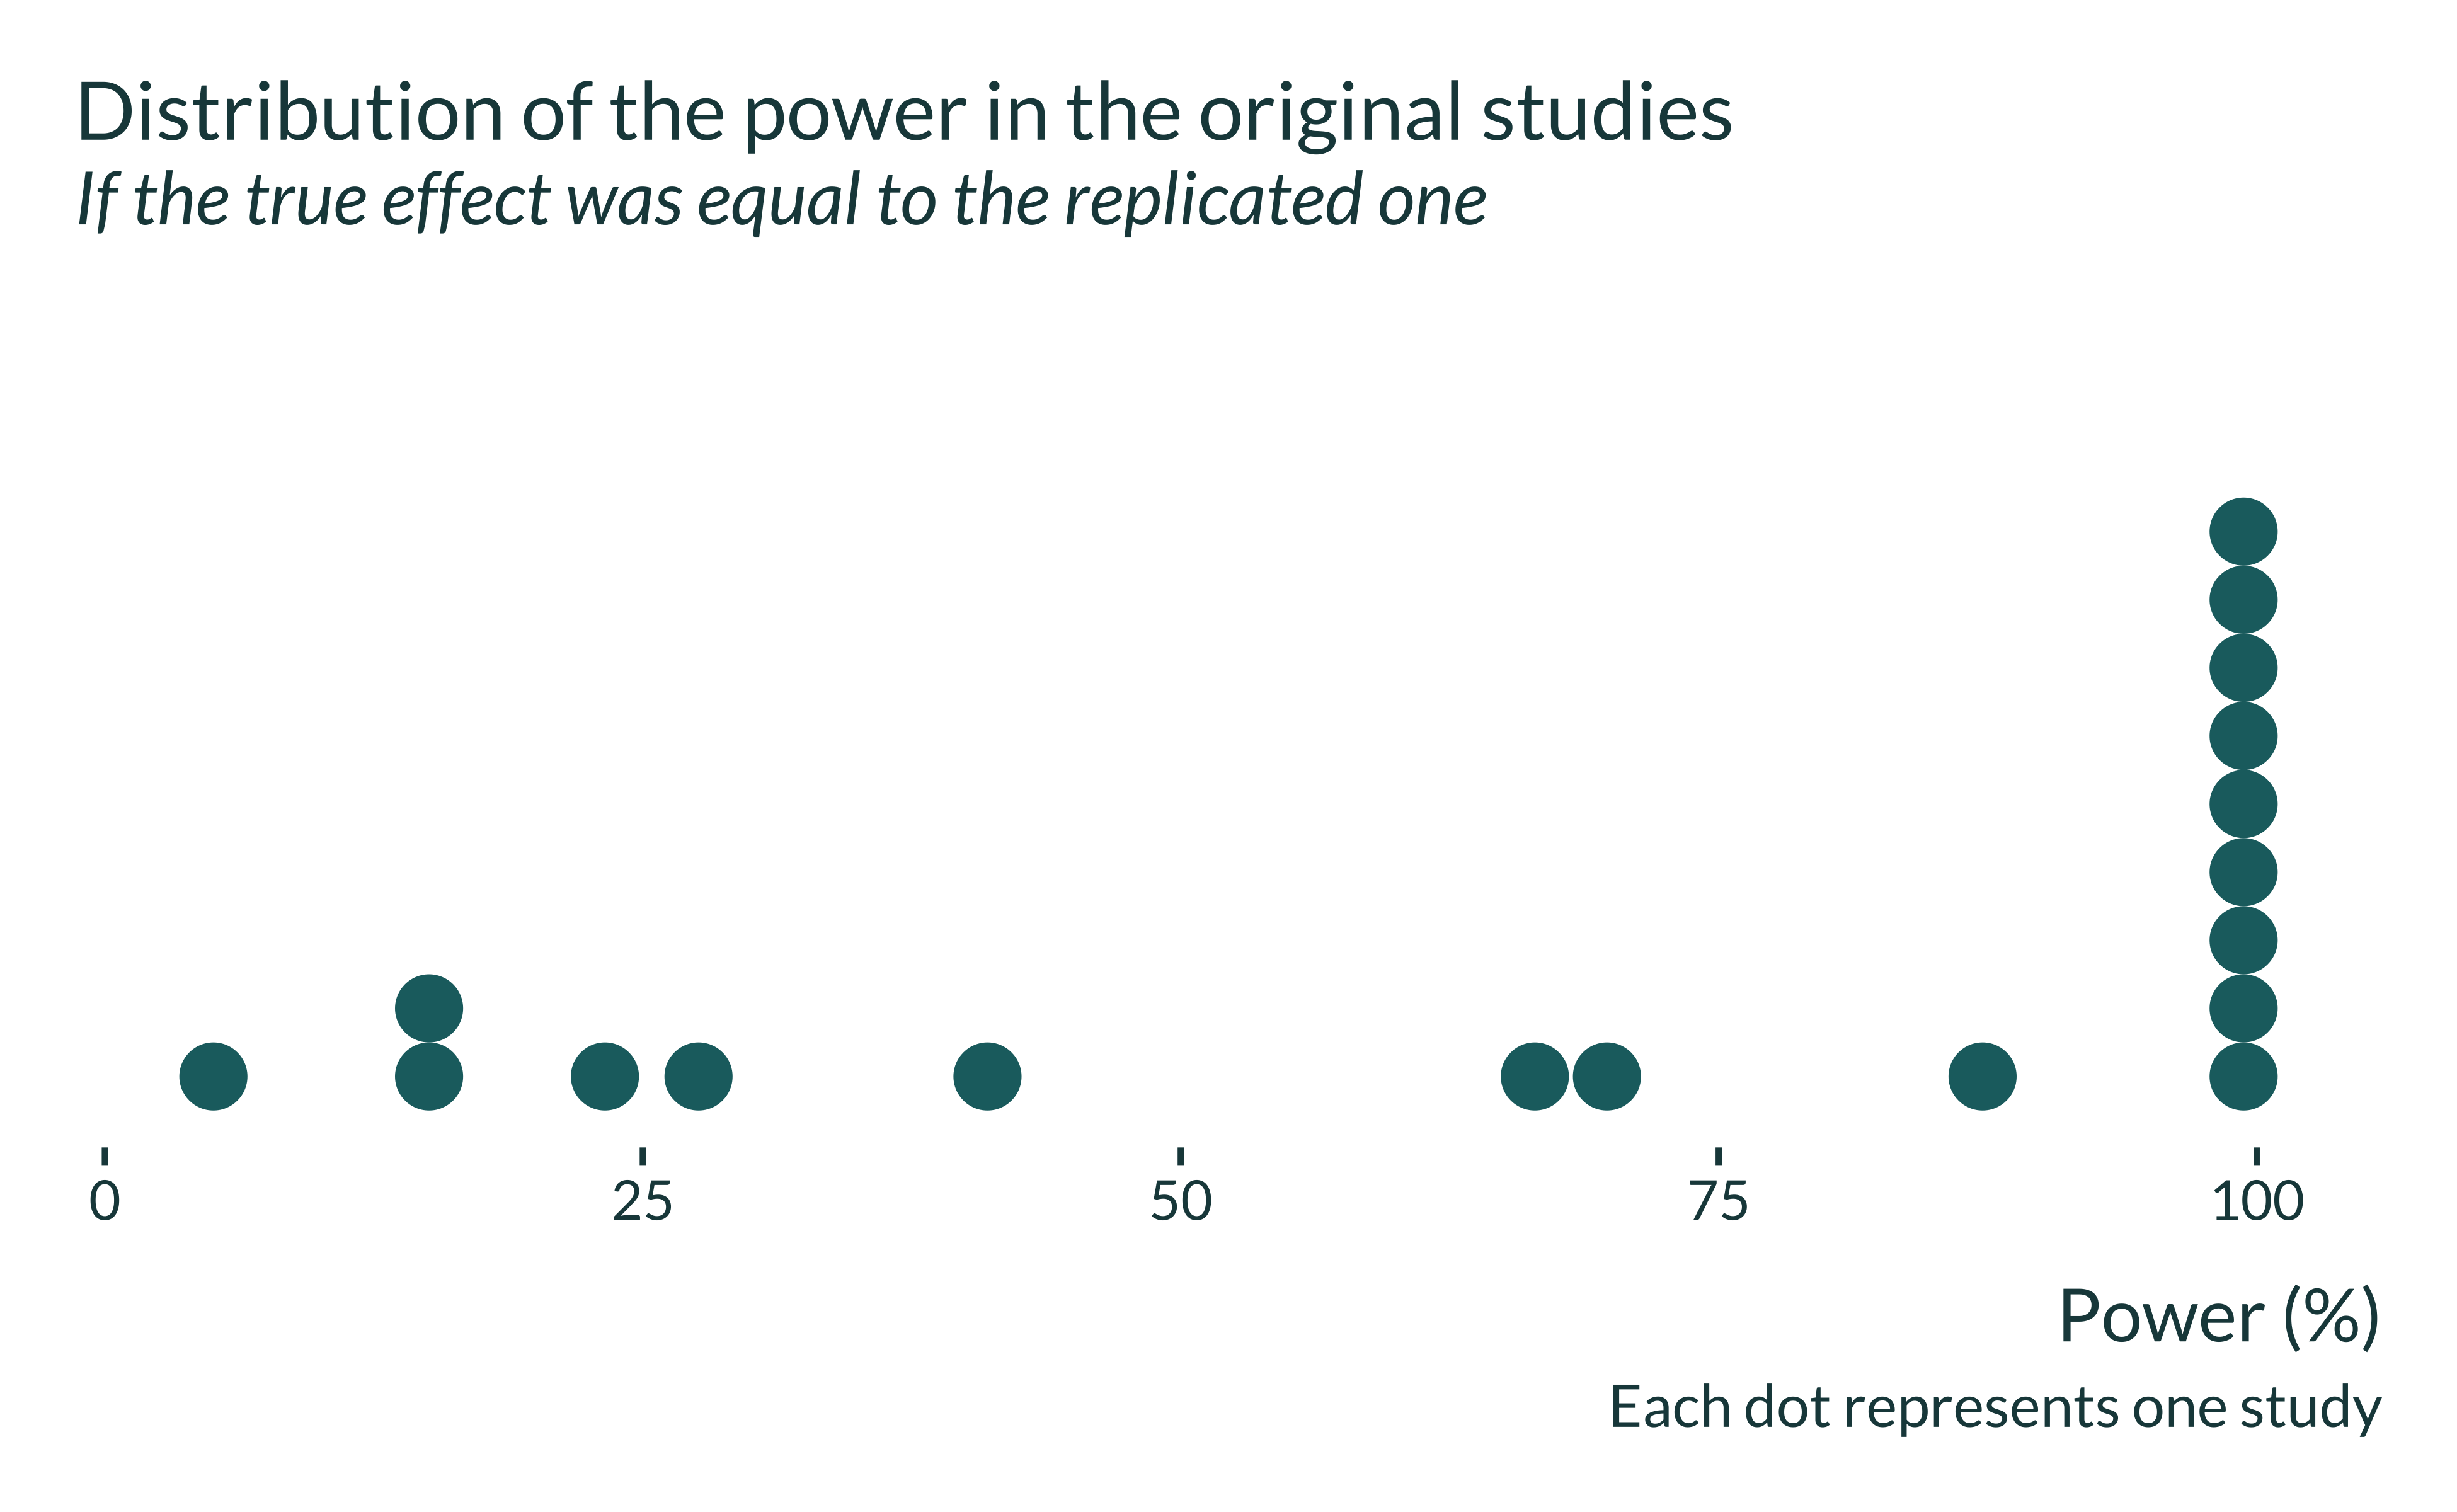
A non-negligible portion of the studies has a low power to detect the original results and are therefore likely to produce inflated statistically significant estimates. One study produces extremely large exaggeration.
Adequate Power
I finally compute the proportion of original studies that would have adequate power as defined by the customary and arbitrary 80% threshold, still assuming that the true effect is equal to the replication one.
Show code
| Adequate power | Number | Proportion |
|---|---|---|
| No | 8 | 0.44 |
| Yes | 10 | 0.56 |
All these results show that even the experimental literature suffers from power and exaggeration issues, despite power being central to this literature.