Create a custom color scale for ididvar visualizations
scale_fill_idid.RdA function that makes a custom color scale and ensures that breaks in terms of weight size (relative to the average) are consistent across users.
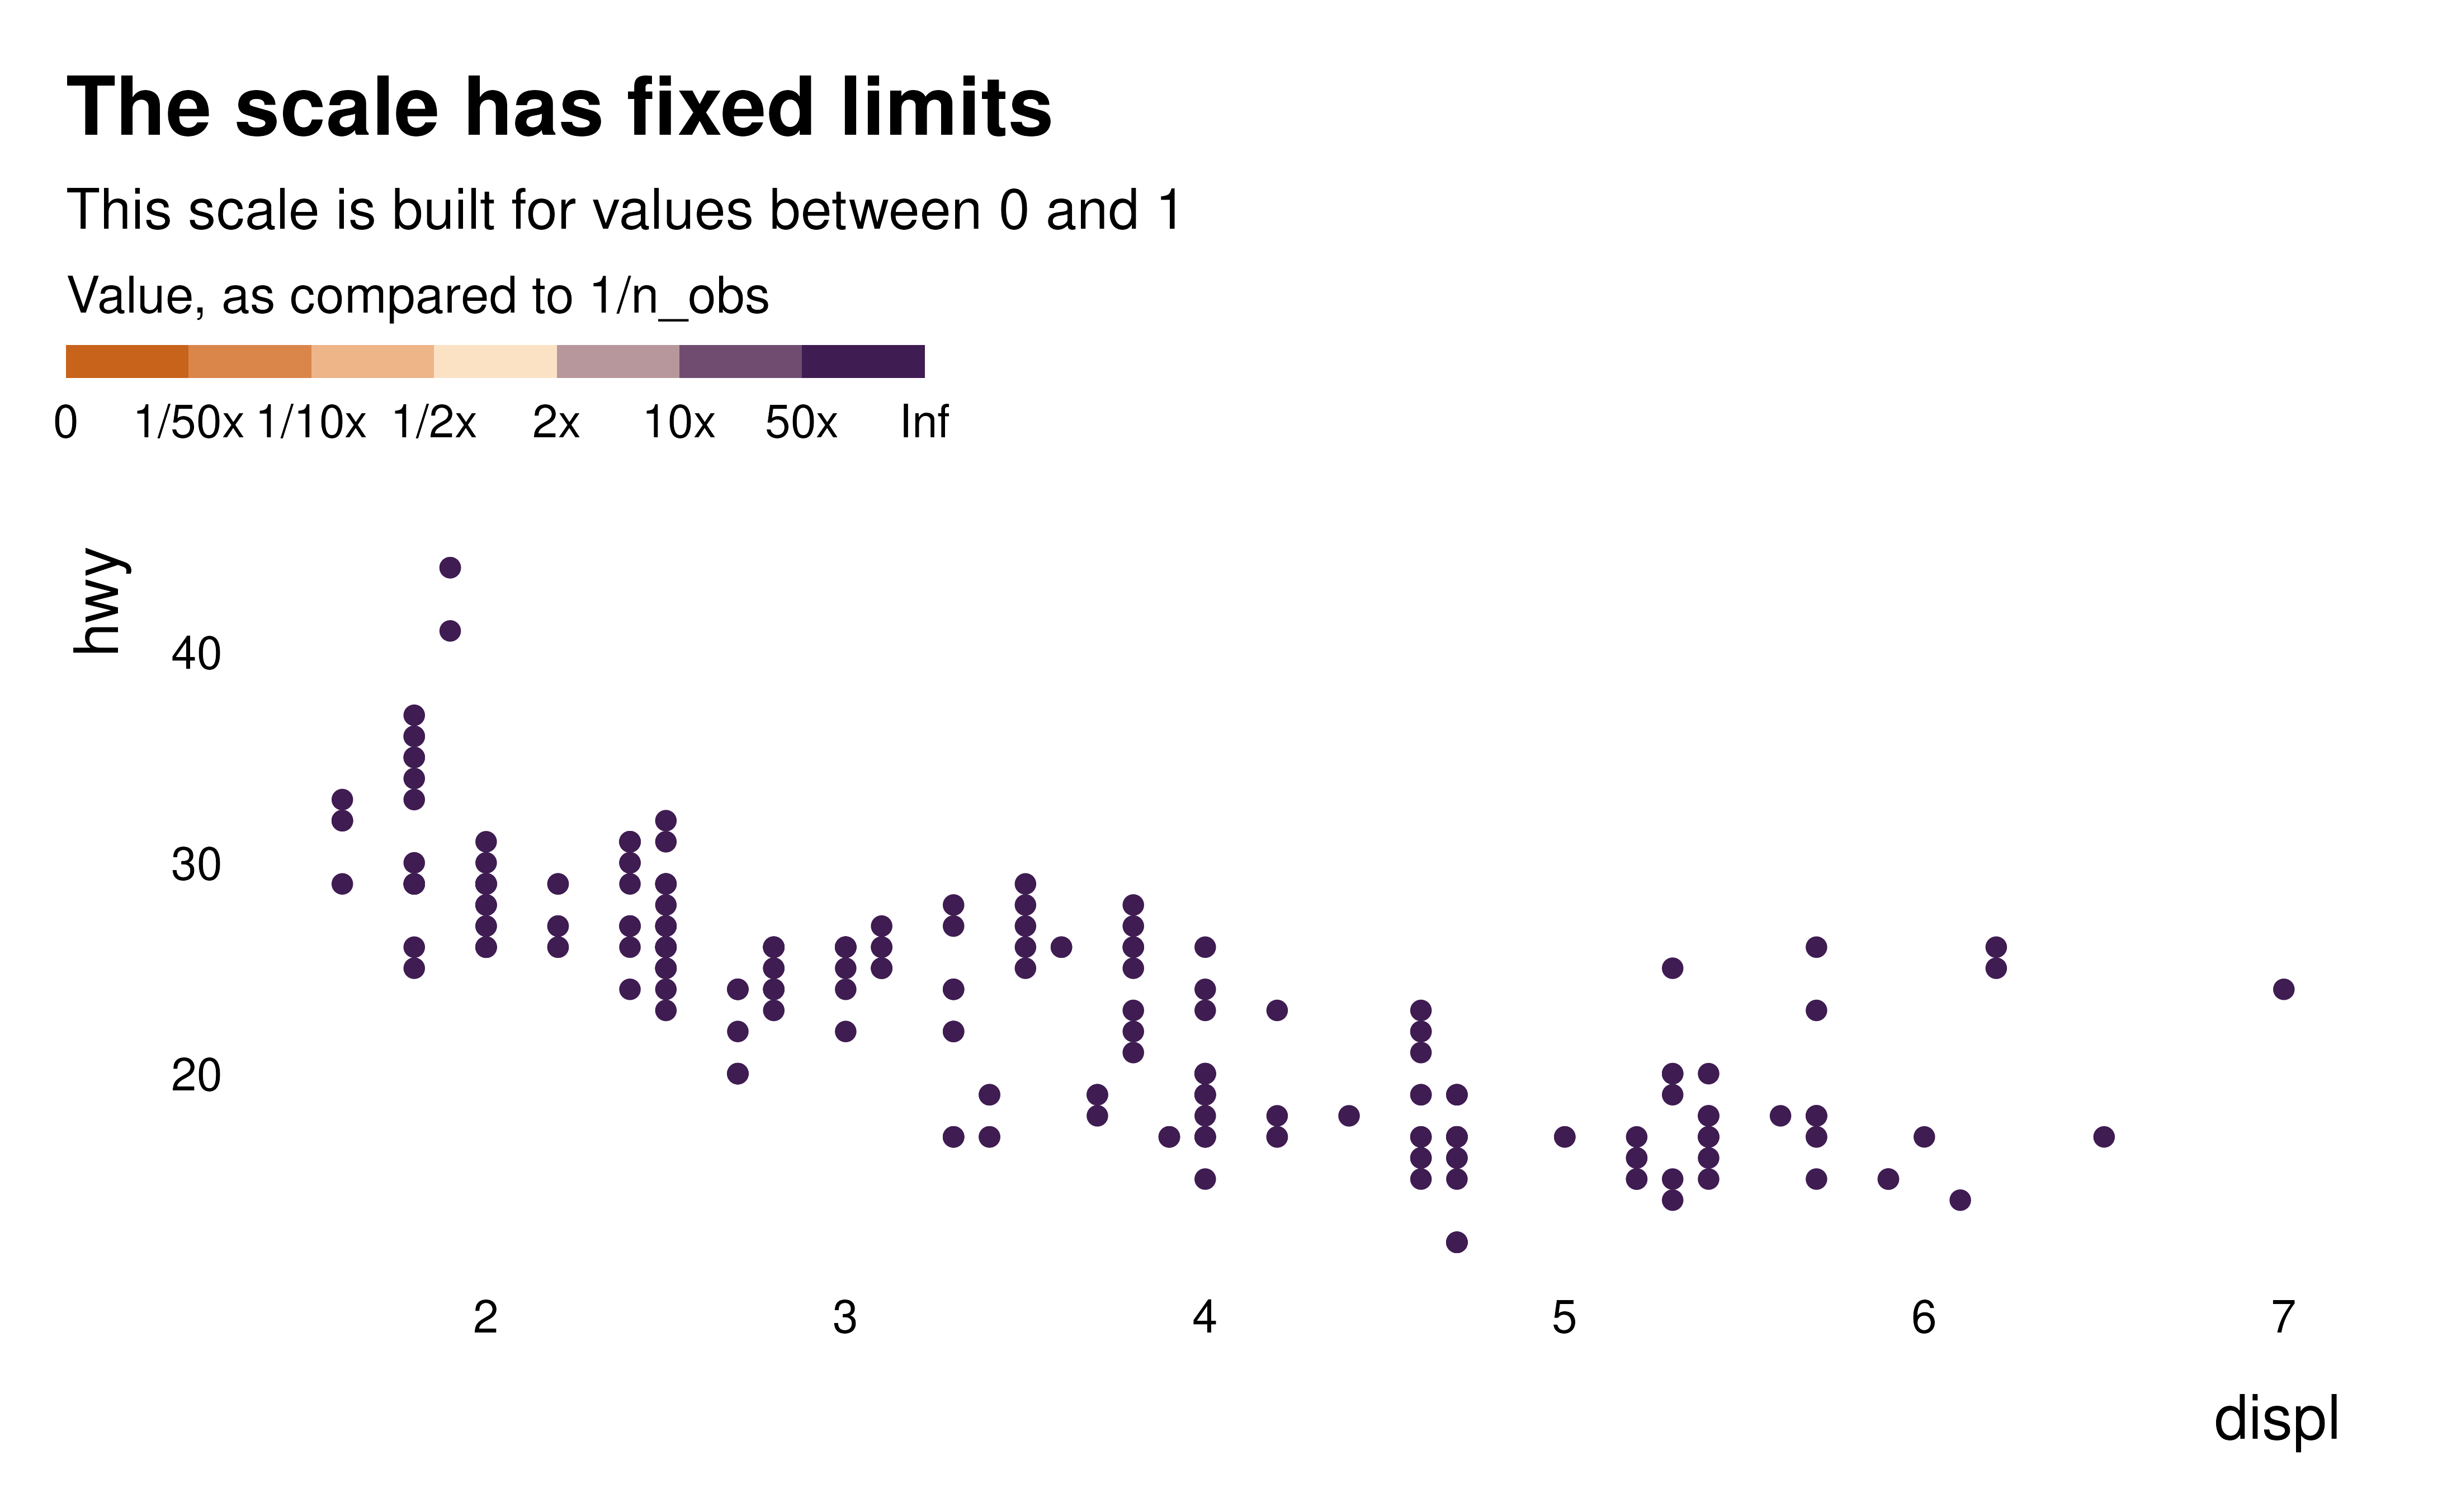
This scale has fixed limits and even if there are no very small or very large weights, the scale remains the same and some color do not appear on the graph (see the second example graph). Note that the labels of the scale are specific to ididvar application and built with weights whose sum equals 1 in mind (and thus whose average is equal to 1/n_obs).
Arguments
- colors
A string vector of colors for the palette. I recommend to pass a vector of 3 distinct colors, with a lighter color in the middle, constituting a diverging scale. It allows a clear distinction between contributing and non contributing observations.
- ...
Additional arguments to be passed to the
ggplot2::scale_fill_stepsnorggplot2::scale_color_stepsnfunction
Examples
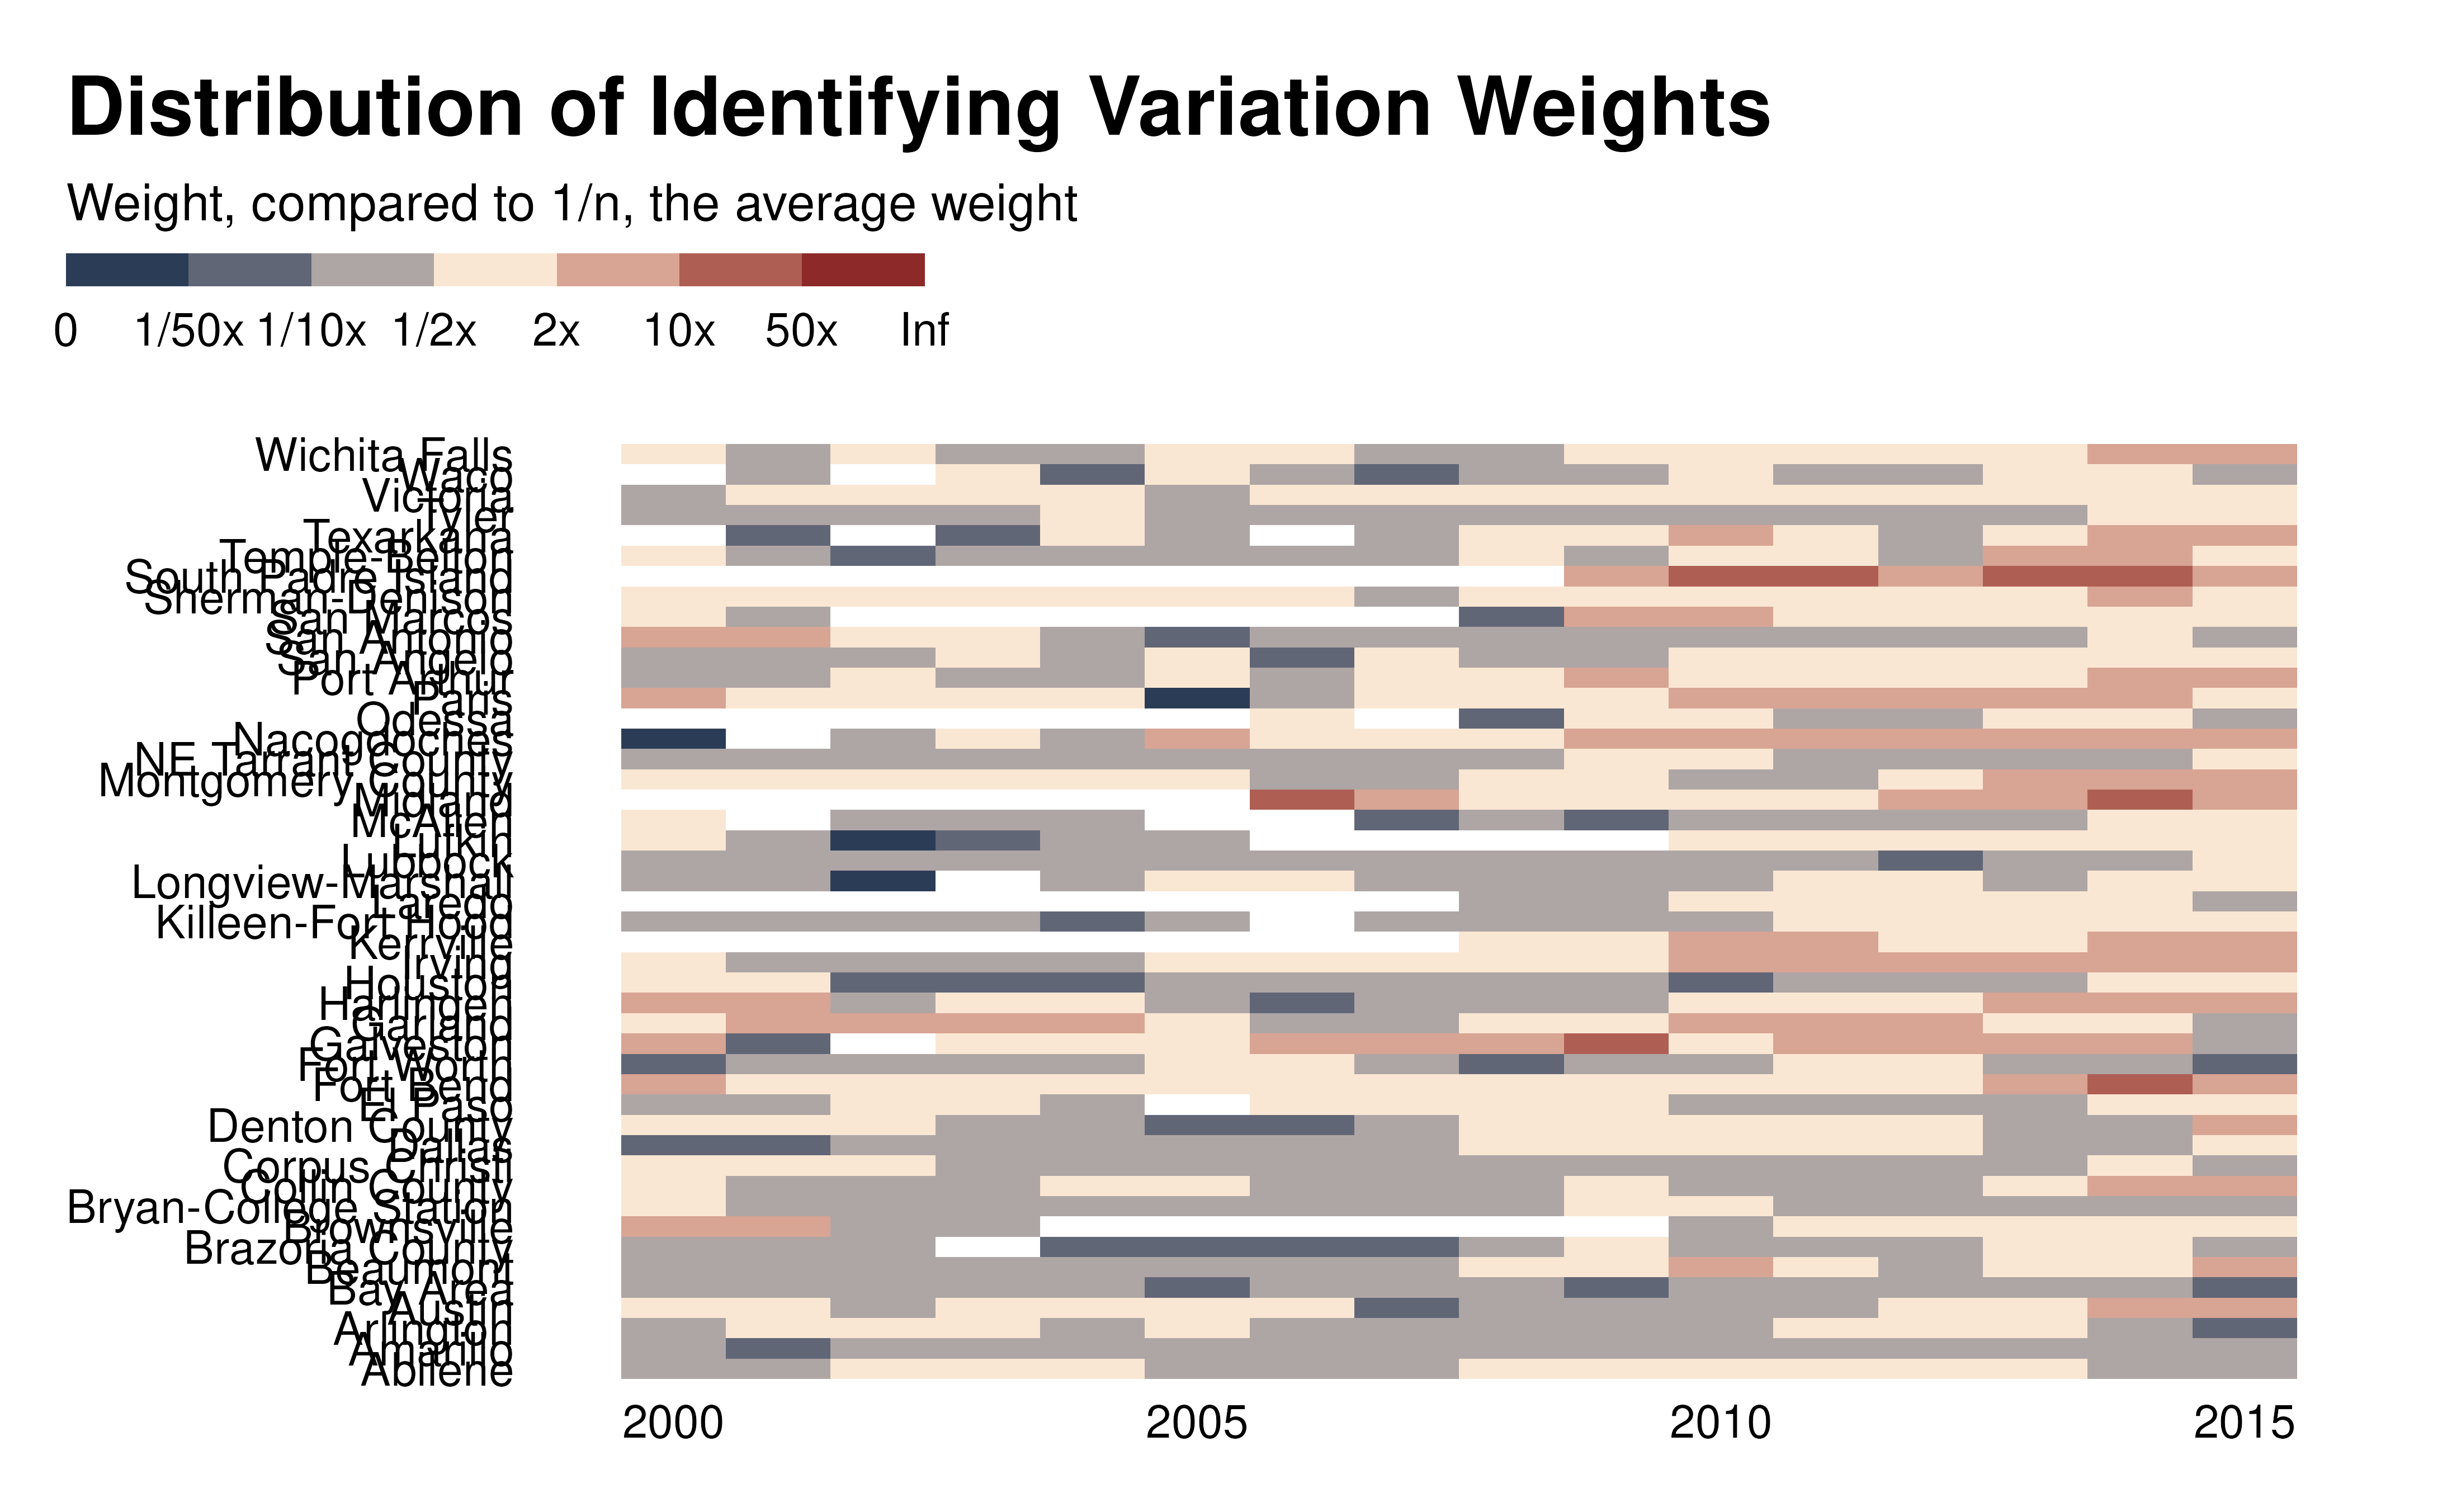
reg_ex_fixest <- ggplot2::txhousing |>
  fixest::feols(fml = log(sales) ~ median + listings |  as.factor(date) + city)
#> NOTE: 1,434 observations removed because of NA values (LHS: 568, RHS: 1,434).

idid_viz_weights(reg_ex_fixest, "median", year, city) +
  ggplot2::labs(x = NULL, y = NULL) +
  scale_fill_idid(colors = c("#19304d", "#fae7d3", "#84141e"))
#> NOTE: 1,434 observations removed because of NA values (LHS: 616, RHS: 1,424).
#> Scale for fill is already present.
#> Adding another scale for fill, which will replace the existing scale.
#> Warning: Removed 1434 rows containing non-finite outside the scale range
#> (`stat_log_weight()`).


ggplot2::mpg |>
  ggplot2::ggplot(ggplot2::aes(x = displ, hwy, color = cyl)) +
  ggplot2::geom_point() +
  ggplot2::labs(
    title = "The scale has fixed limits",
    subtitle = "This scale is built for values between 0 and 1",
    color = "Value, as compared to 1/n_obs"
  ) +
  theme_idid() +
  scale_color_idid()
ggplot2::mpg |>
ggplot2::ggplot(ggplot2::aes(x = displ, hwy, color = cyl)) +
ggplot2::geom_point() +
ggplot2::labs(
title = "The scale has fixed limits",
subtitle = "This scale is built for values between 0 and 1",
color = "Value, as compared to 1/n_obs"
) +
theme_idid() +
scale_color_idid()