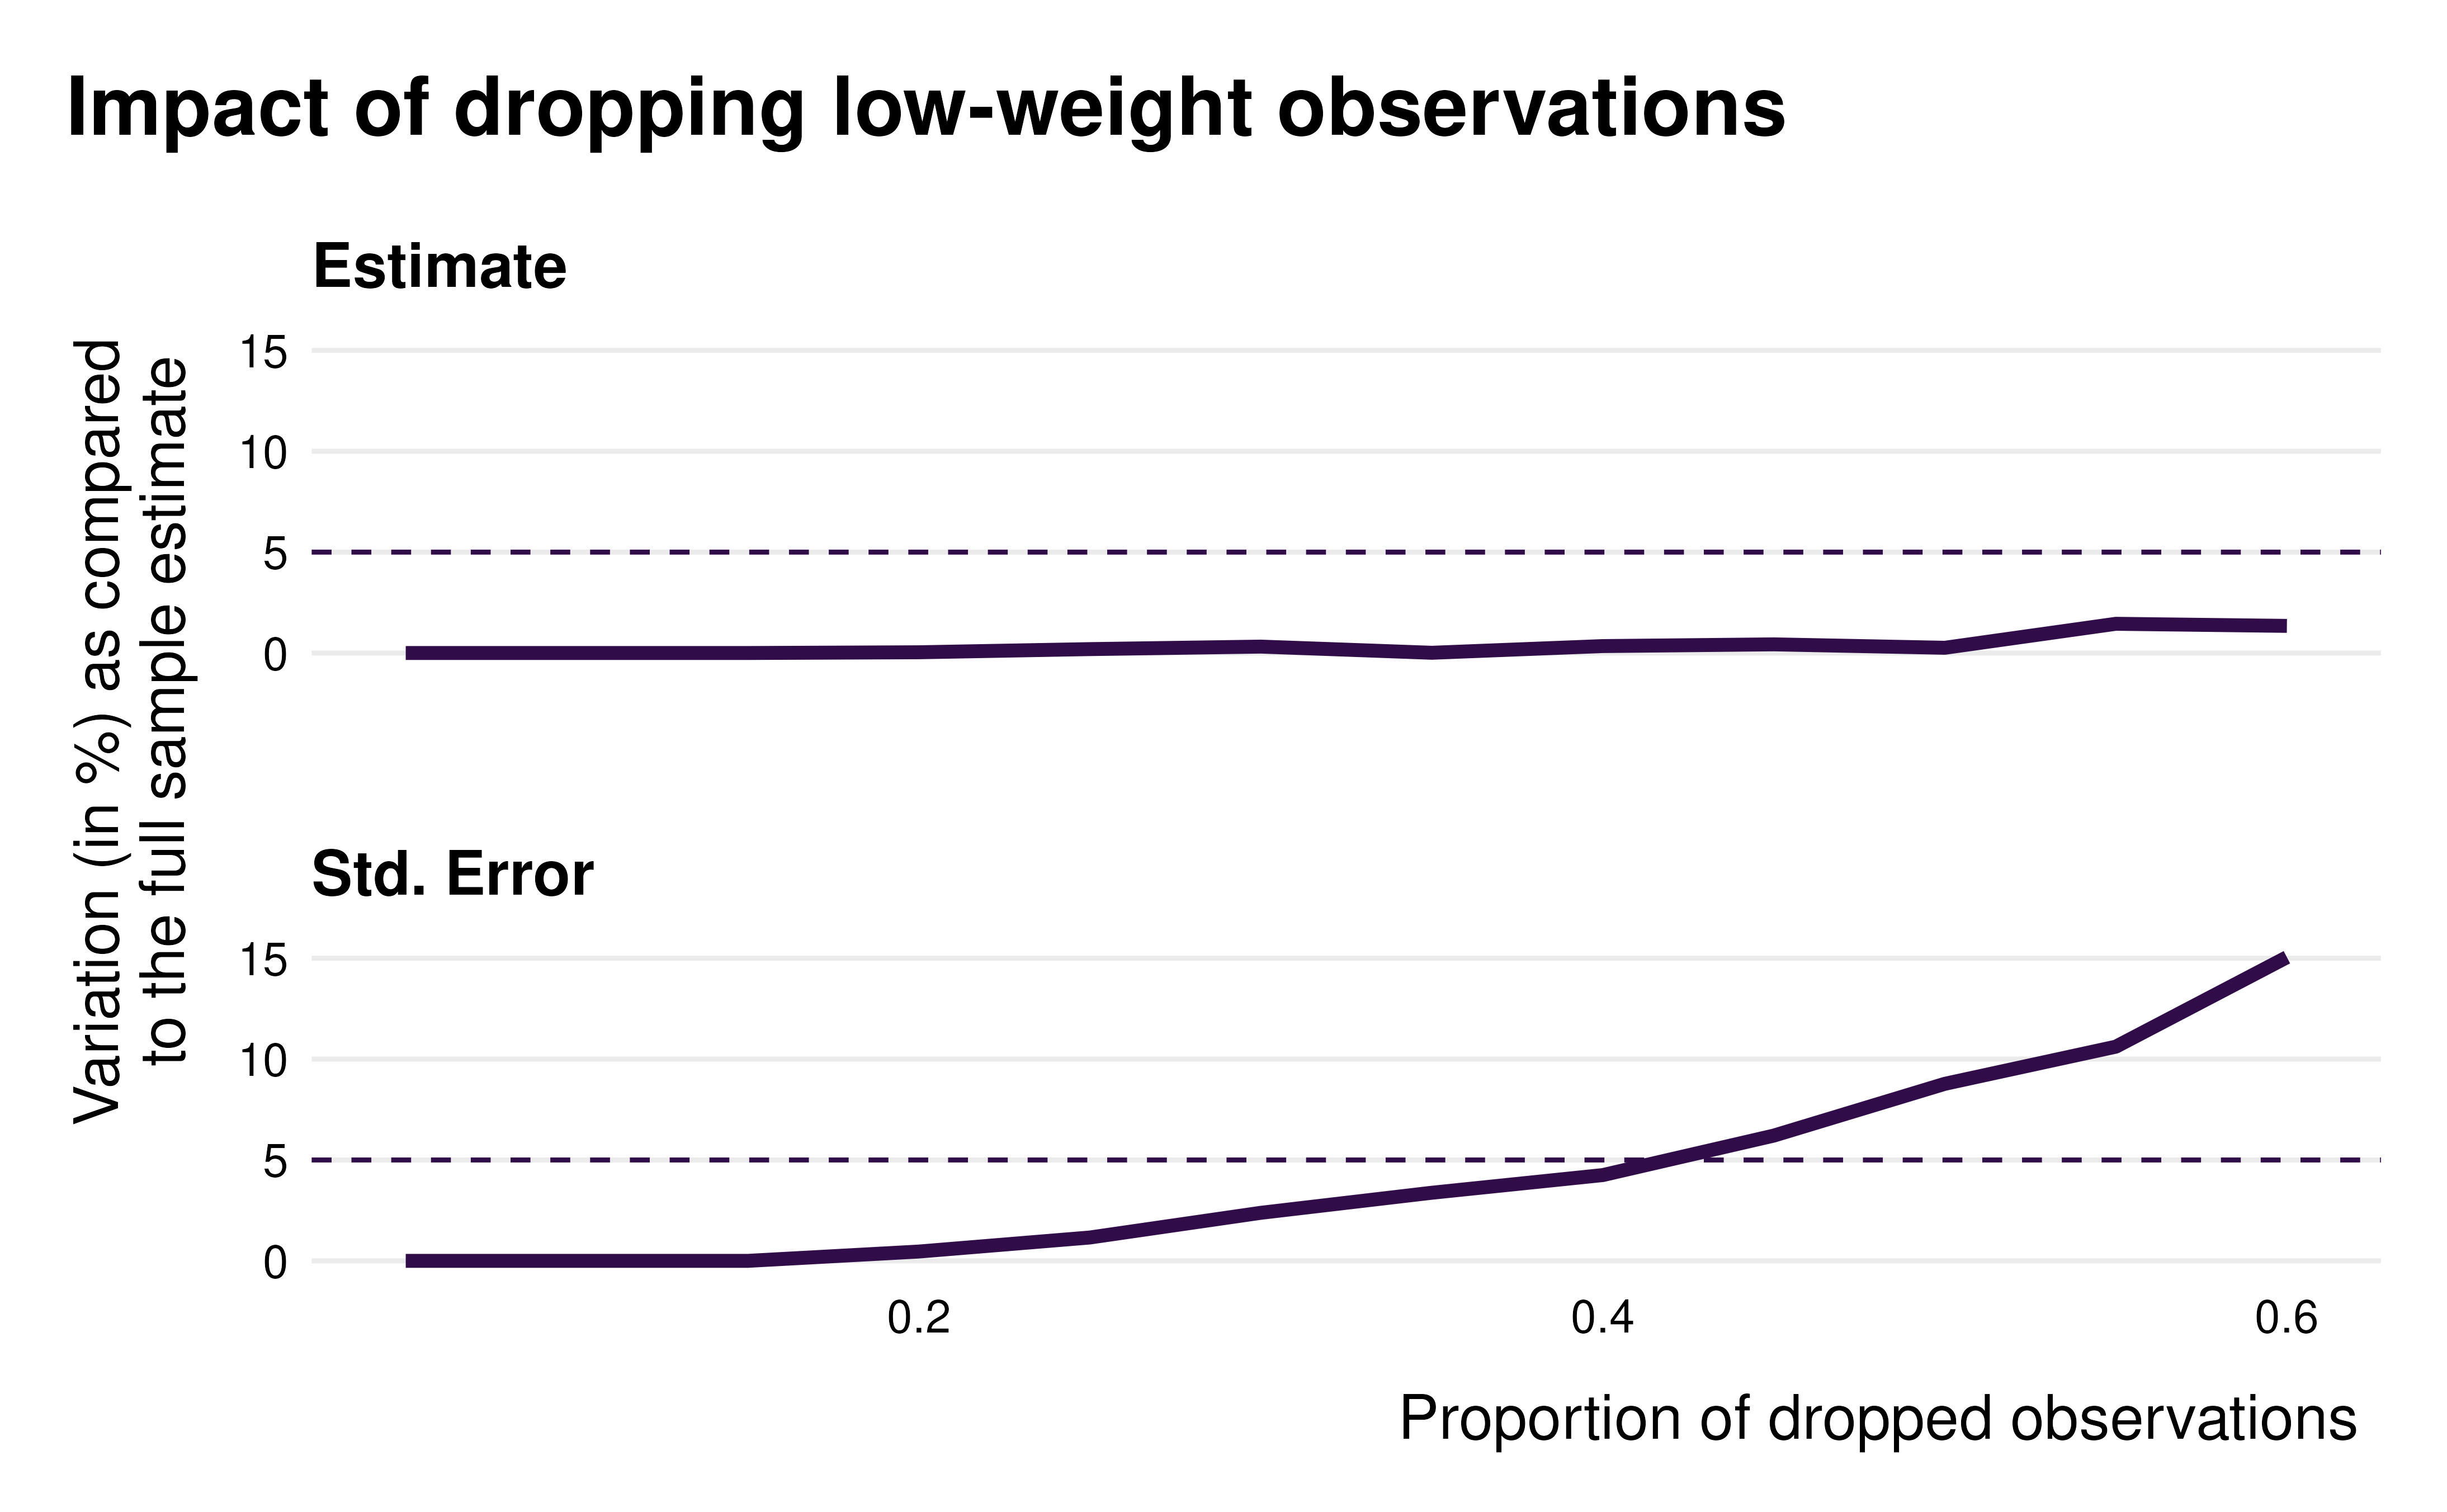
Visualize changes in point estimate and s.e. when dropping observations
idid_viz_drop_change.RdMake a faceted line graph describing the percentage variation of the point estimate and s.e. of interest as a function of the proportion of observations dropped.
Usage
idid_viz_drop_change(
  reg,
  var_interest,
  threshold_change = 0.05,
  search_step = 0.05,
  search_start = search_step,
  search_end = 1 - search_step,
  facet = "both",
  color = "#300D49",
  ...
)
Arguments
- reg
A regression object.
- var_interest
A vector string. The name of the variables of interest.
- threshold_change
A double (between 0 and 1). The change threshold in estimate and s.e. when dropping observations.
- search_step
A double (between 0 and 1). The additional proportion of observations to drop in each iteration of the loop.
- search_start
A numeric (between 0 and 1). Proportion of observation to drop in the first step of the loop in
idid_contrib_threshold.- search_end
A numeric (between 0 and 1). Proportion of observation to drop in the last step of the loop in
idid_contrib_threshold.- facet
A character. When equal to "both", will display both the estimate and standard error graph. When equal to "estimate" only the former will be displayed and when equal to "se", only the latter.
- color
A string. Color of the graph.
- ...
Additional elements to pass to the regression function when partialling out controls.