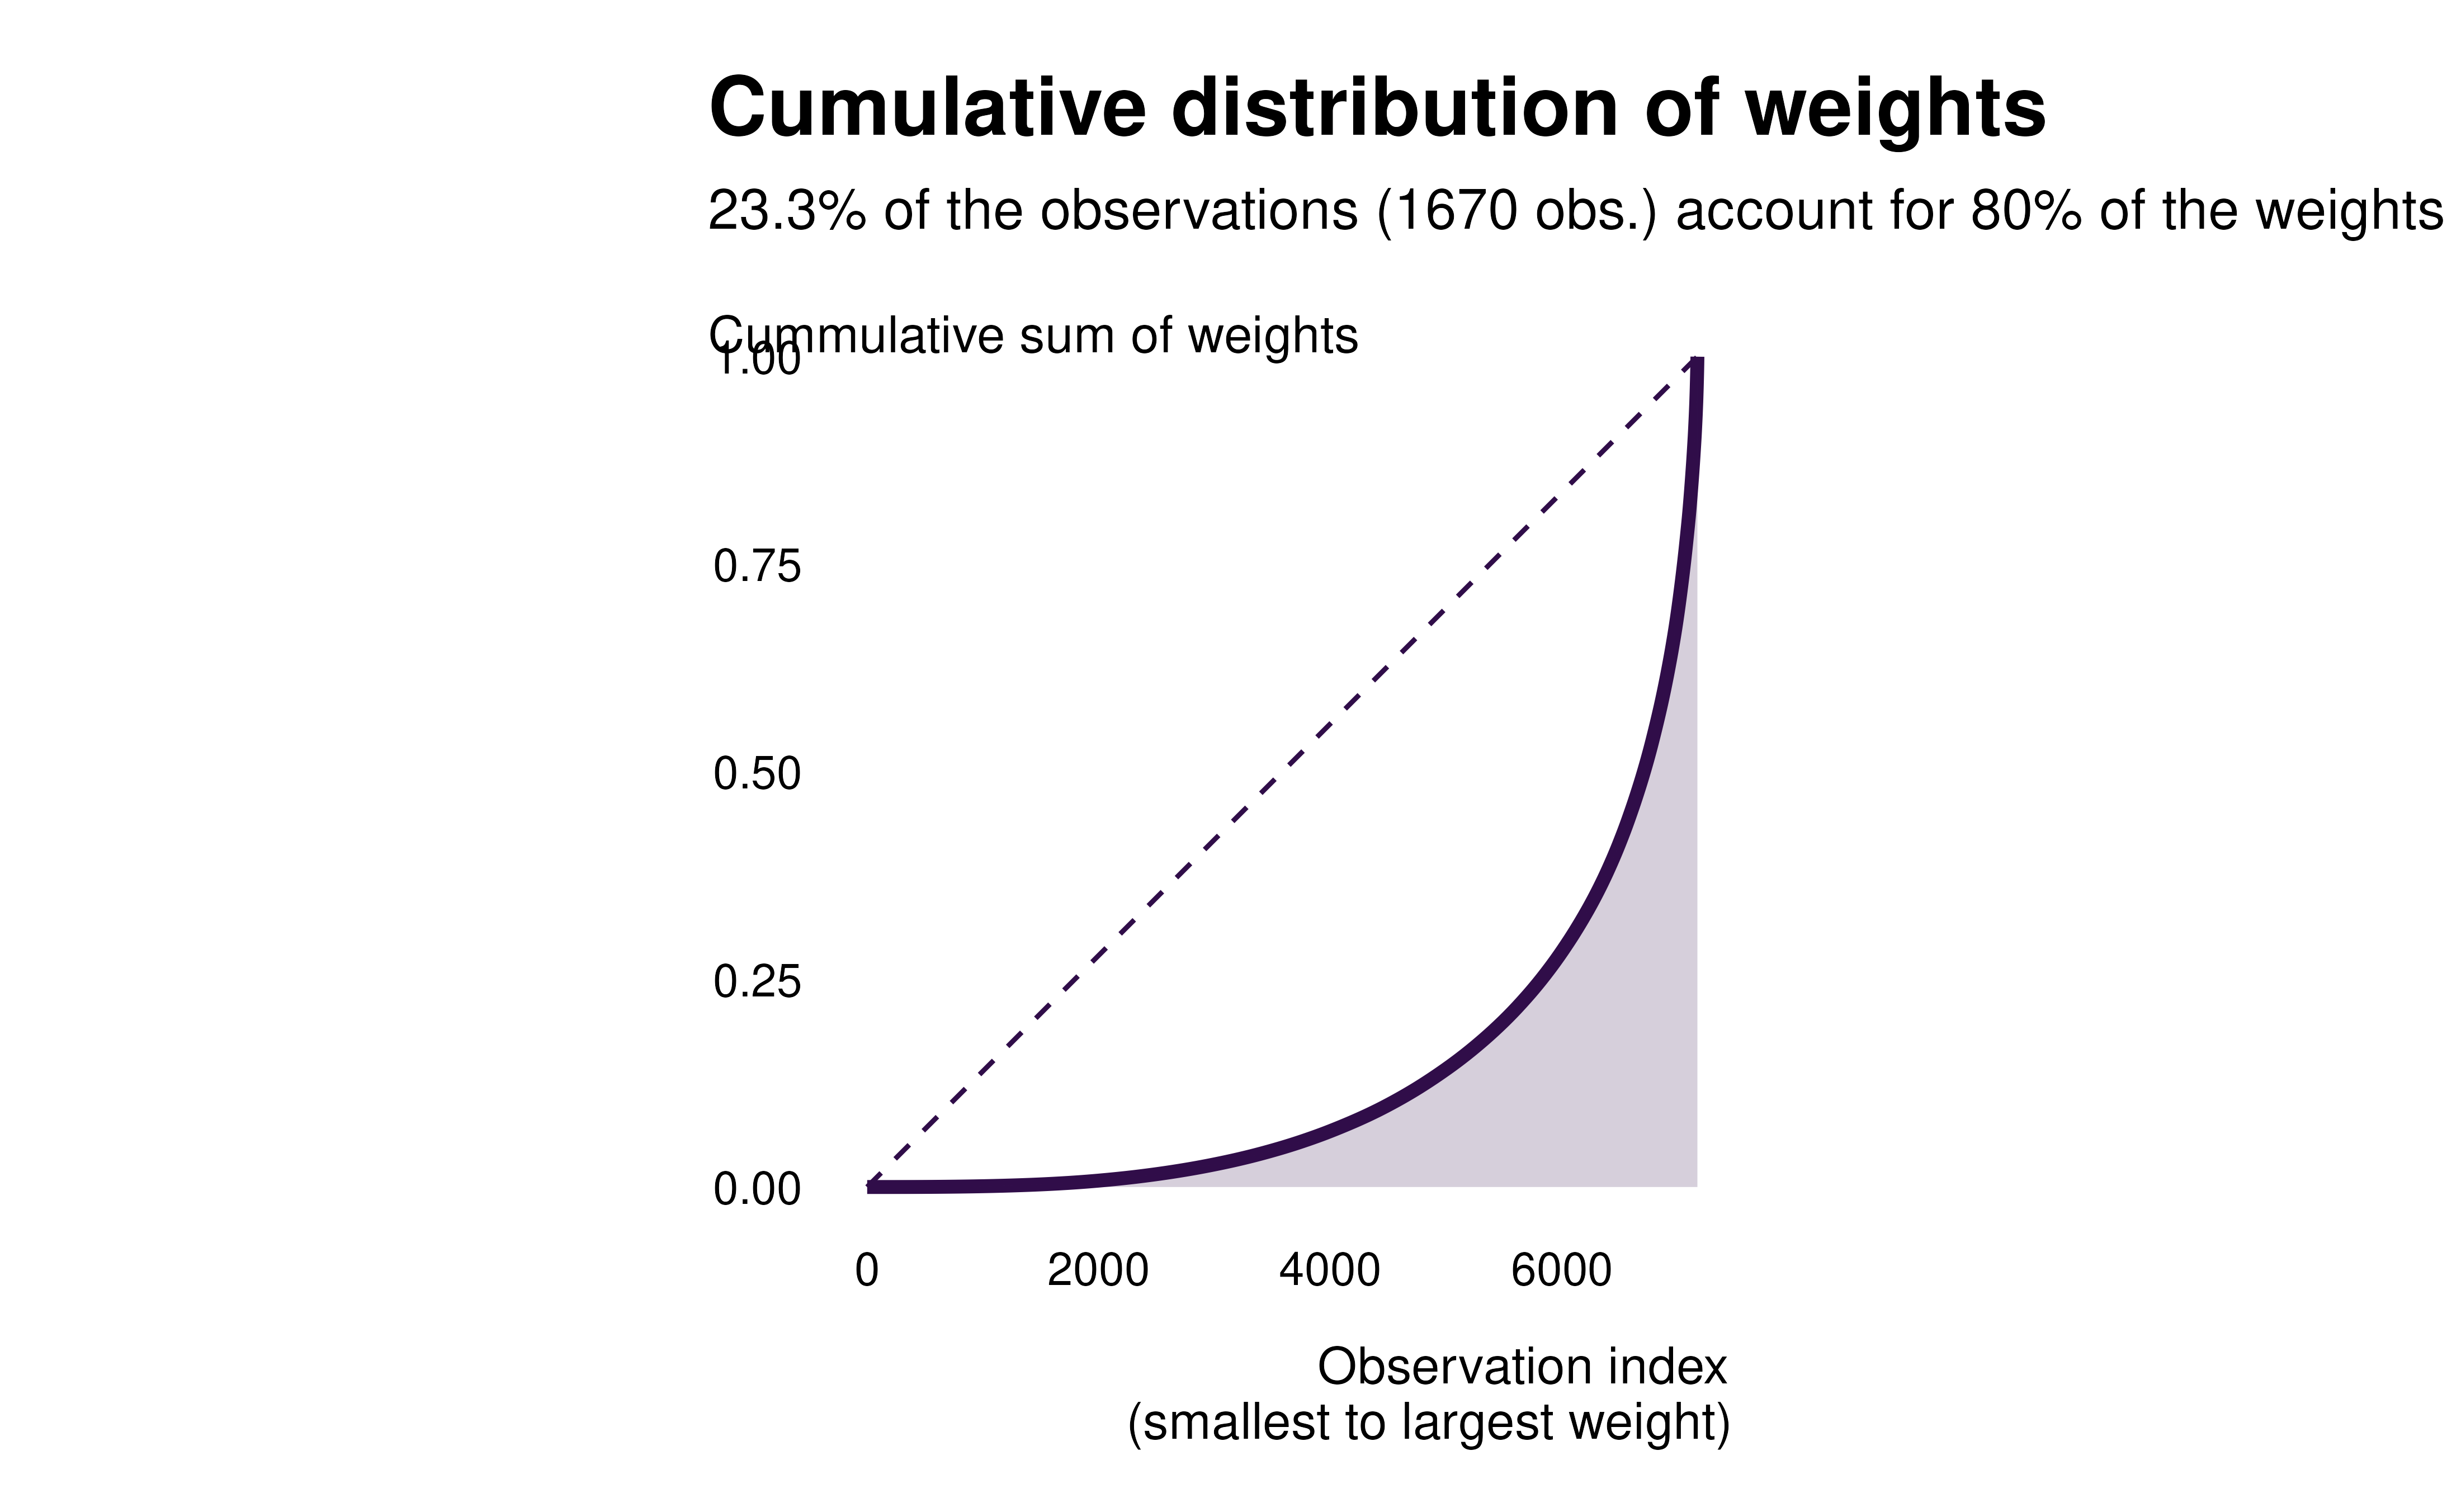
Visualization of the cumulative distribution of weights
idid_viz_cumul.RdVisualization of the cumulative distribution of weights
Arguments
- reg
A regression object.
- var_interest
A vector string. The name of the variables of interest.
- prop_weights
A numeric (between 0 and 1). A proportion of weights that to consider as contributing the most to identification. Used to build the subtitle.
- color
A string. Color of the graph.
- ...
Additional elements to pass to the regression function when partialling out controls.