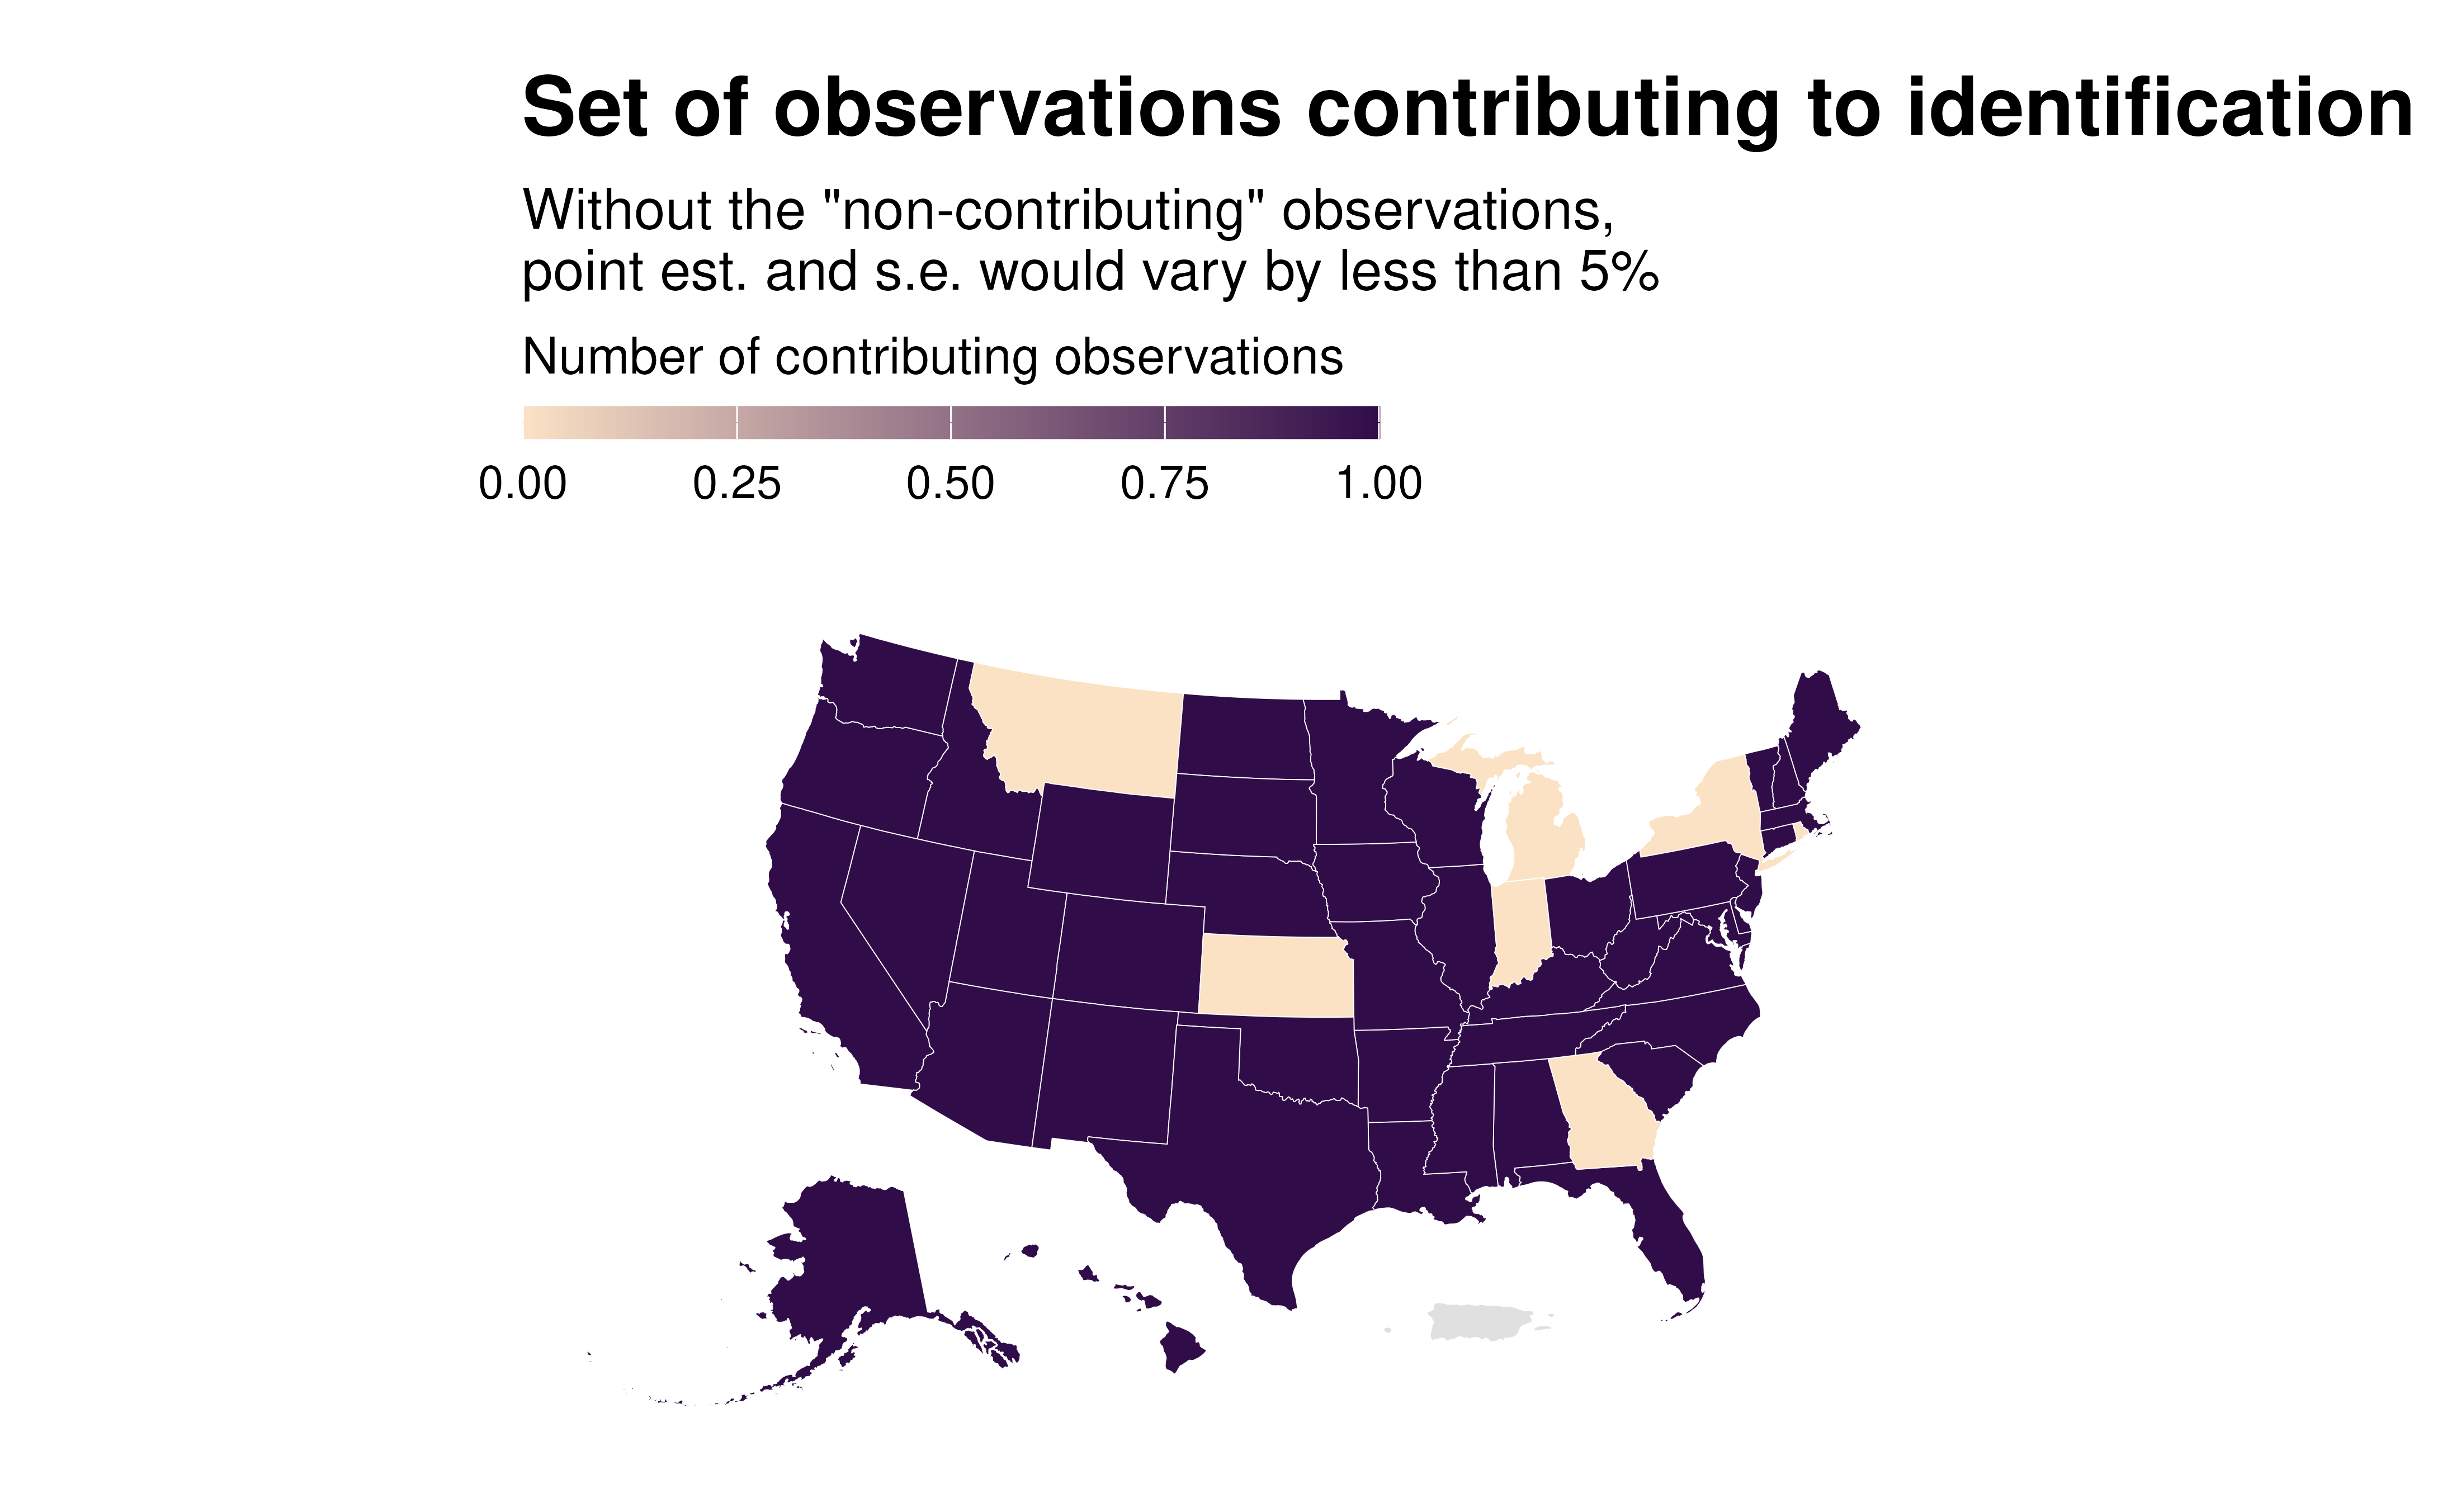
Plot a map of the effective sample
idid_viz_contrib_map.RdMakes a map to visualize observations that can be dropped without
changing the point estimate or the standard error of the estimate of
interest by more than a given proportion (threshold_change).
Usage
idid_viz_contrib_map(
  reg,
  var_interest,
  shape_file,
  join_by,
  contrib_threshold,
  threshold_change = 0.05,
  colors = c("#C25807", "#FBE2C5", "#300D49"),
  ...
)
Arguments
- reg
A regression object.
- var_interest
A vector string. The name of the variables of interest.
- shape_file
An
sfobject. The shape file to map the weights on.- join_by
A character string. The name of the variable in the original data and in
shape_fileand along which the matching should be performed.- contrib_threshold
A numeric (optional). Weight below which observations are deemed to be non-contributing. If not provided, will be determined by running
ididvar::idid_contrib_threshold- threshold_change
A double (between 0 and 1). The change threshold in estimate and s.e. when dropping observations.
- colors
A string vector of colors for the palette. I recommend to pass a vector of 3 distinct colors, with a lighter color in the middle, constituting a diverging scale. It allows a clear distinction between contributing and non contributing observations.
- ...
Additional elements to pass to the regression function when partialling out controls.
Examples
reg <- state.x77 |>
  dplyr::as_tibble() |>
  dplyr::mutate(NAME = rownames(state.x77)) |>
  lm(formula = Illiteracy ~  Income + Population + `Life Exp` + Frost)

states_sf <- tigris::states(
    cb = TRUE, resolution = "20m", year = 2024, progress_bar = FALSE) |>
  tigris::shift_geometry()

idid_viz_contrib_map(reg, "Income", states_sf, "NAME")