Visualization of the relationship between x and y, after partialling out
idid_viz_bivar.RdMakes a bivariate graph to visualize the data and relationship between the outcome and the variable of interest, after having partialLed out controls.
Arguments
- reg
A regression object.
- var_interest
A vector string. The name of the variables of interest.
- partial_iv
A boolean. If TRUE, partials out the part of the endogenous variables that are not explained by the instruments. If the regression is not an IV (or not generated by
AER::ivregorfixest::feolswith an instrumented part), the value ofpartial_ivhas no impact on the outcome of the function.- ...
Additional elements to pass to the regression function when partialling out controls.
Value
A ggplot2 scatter plot and regression line of the relationship between the
outcome and the one of the variables of interest
(the first one specified in the var_interest vector),
after partialling out controls.
Examples
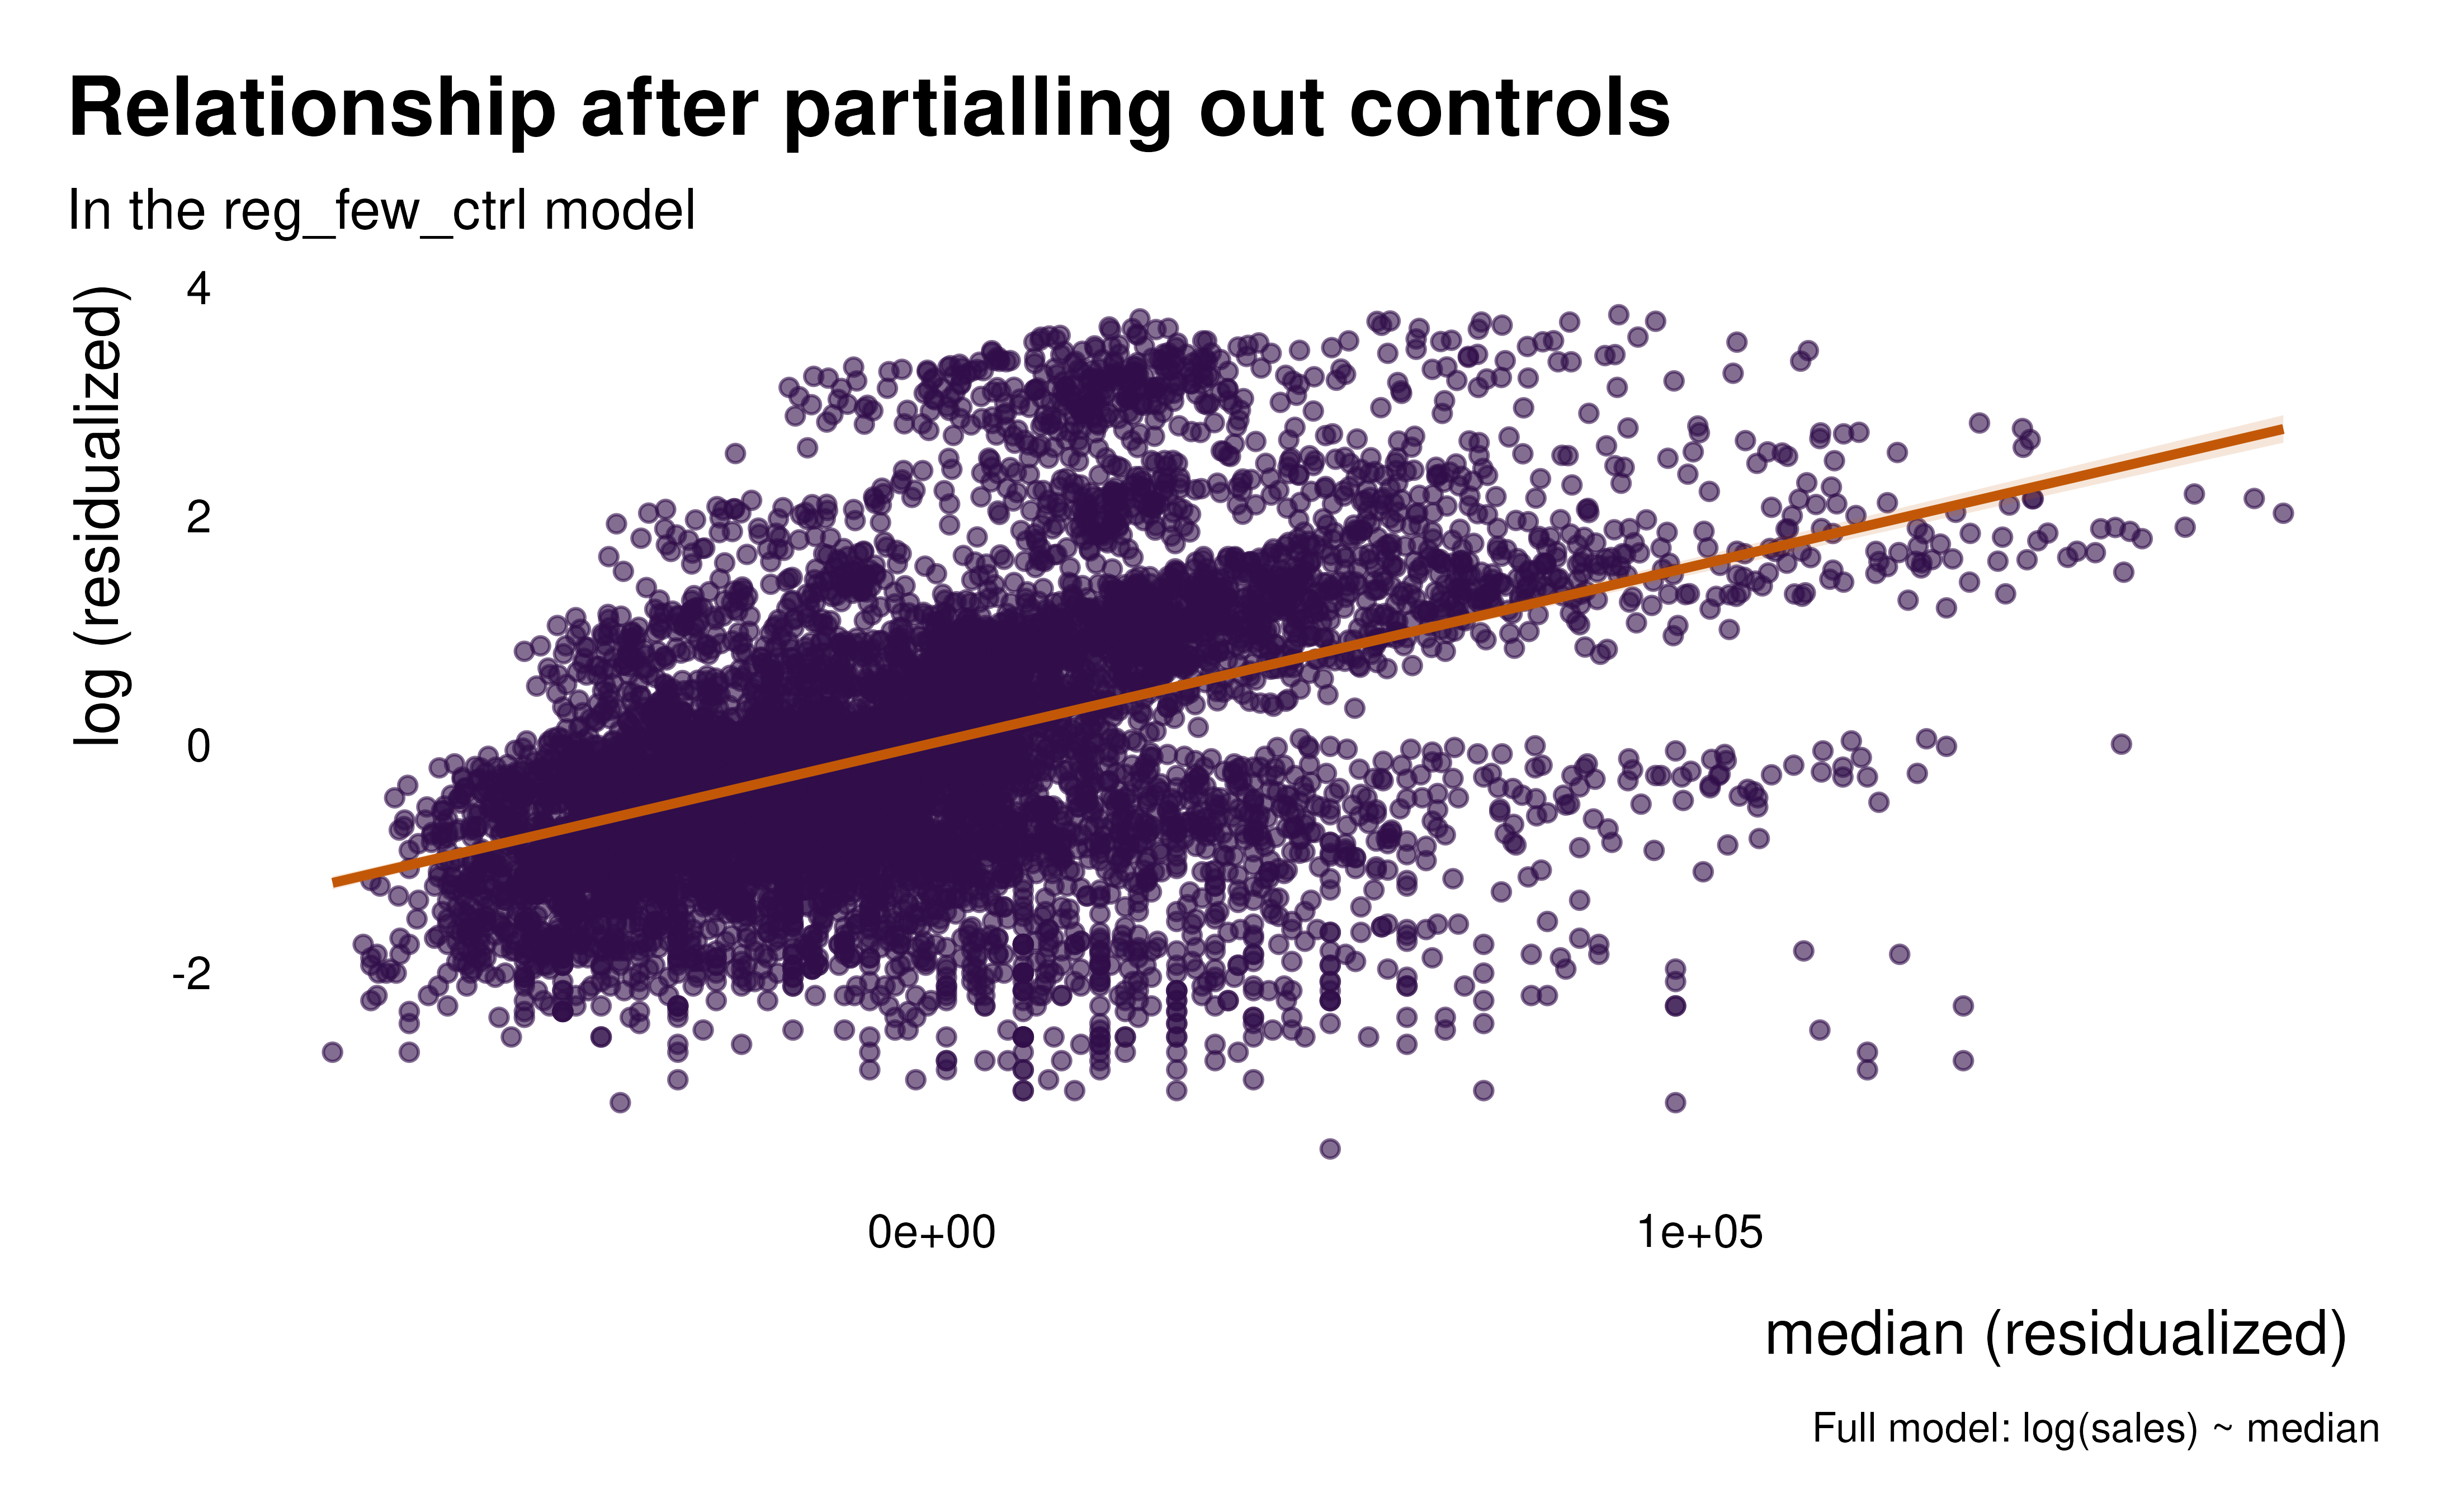
reg_few_ctrl <- ggplot2::txhousing |>
lm(formula = log(sales) ~ median)
idid_viz_bivar(reg_few_ctrl, "median")
#> Warning: Removed 617 rows containing non-finite outside the scale range
#> (`stat_smooth()`).
#> Warning: Removed 617 rows containing missing values or values outside the scale range
#> (`geom_point()`).
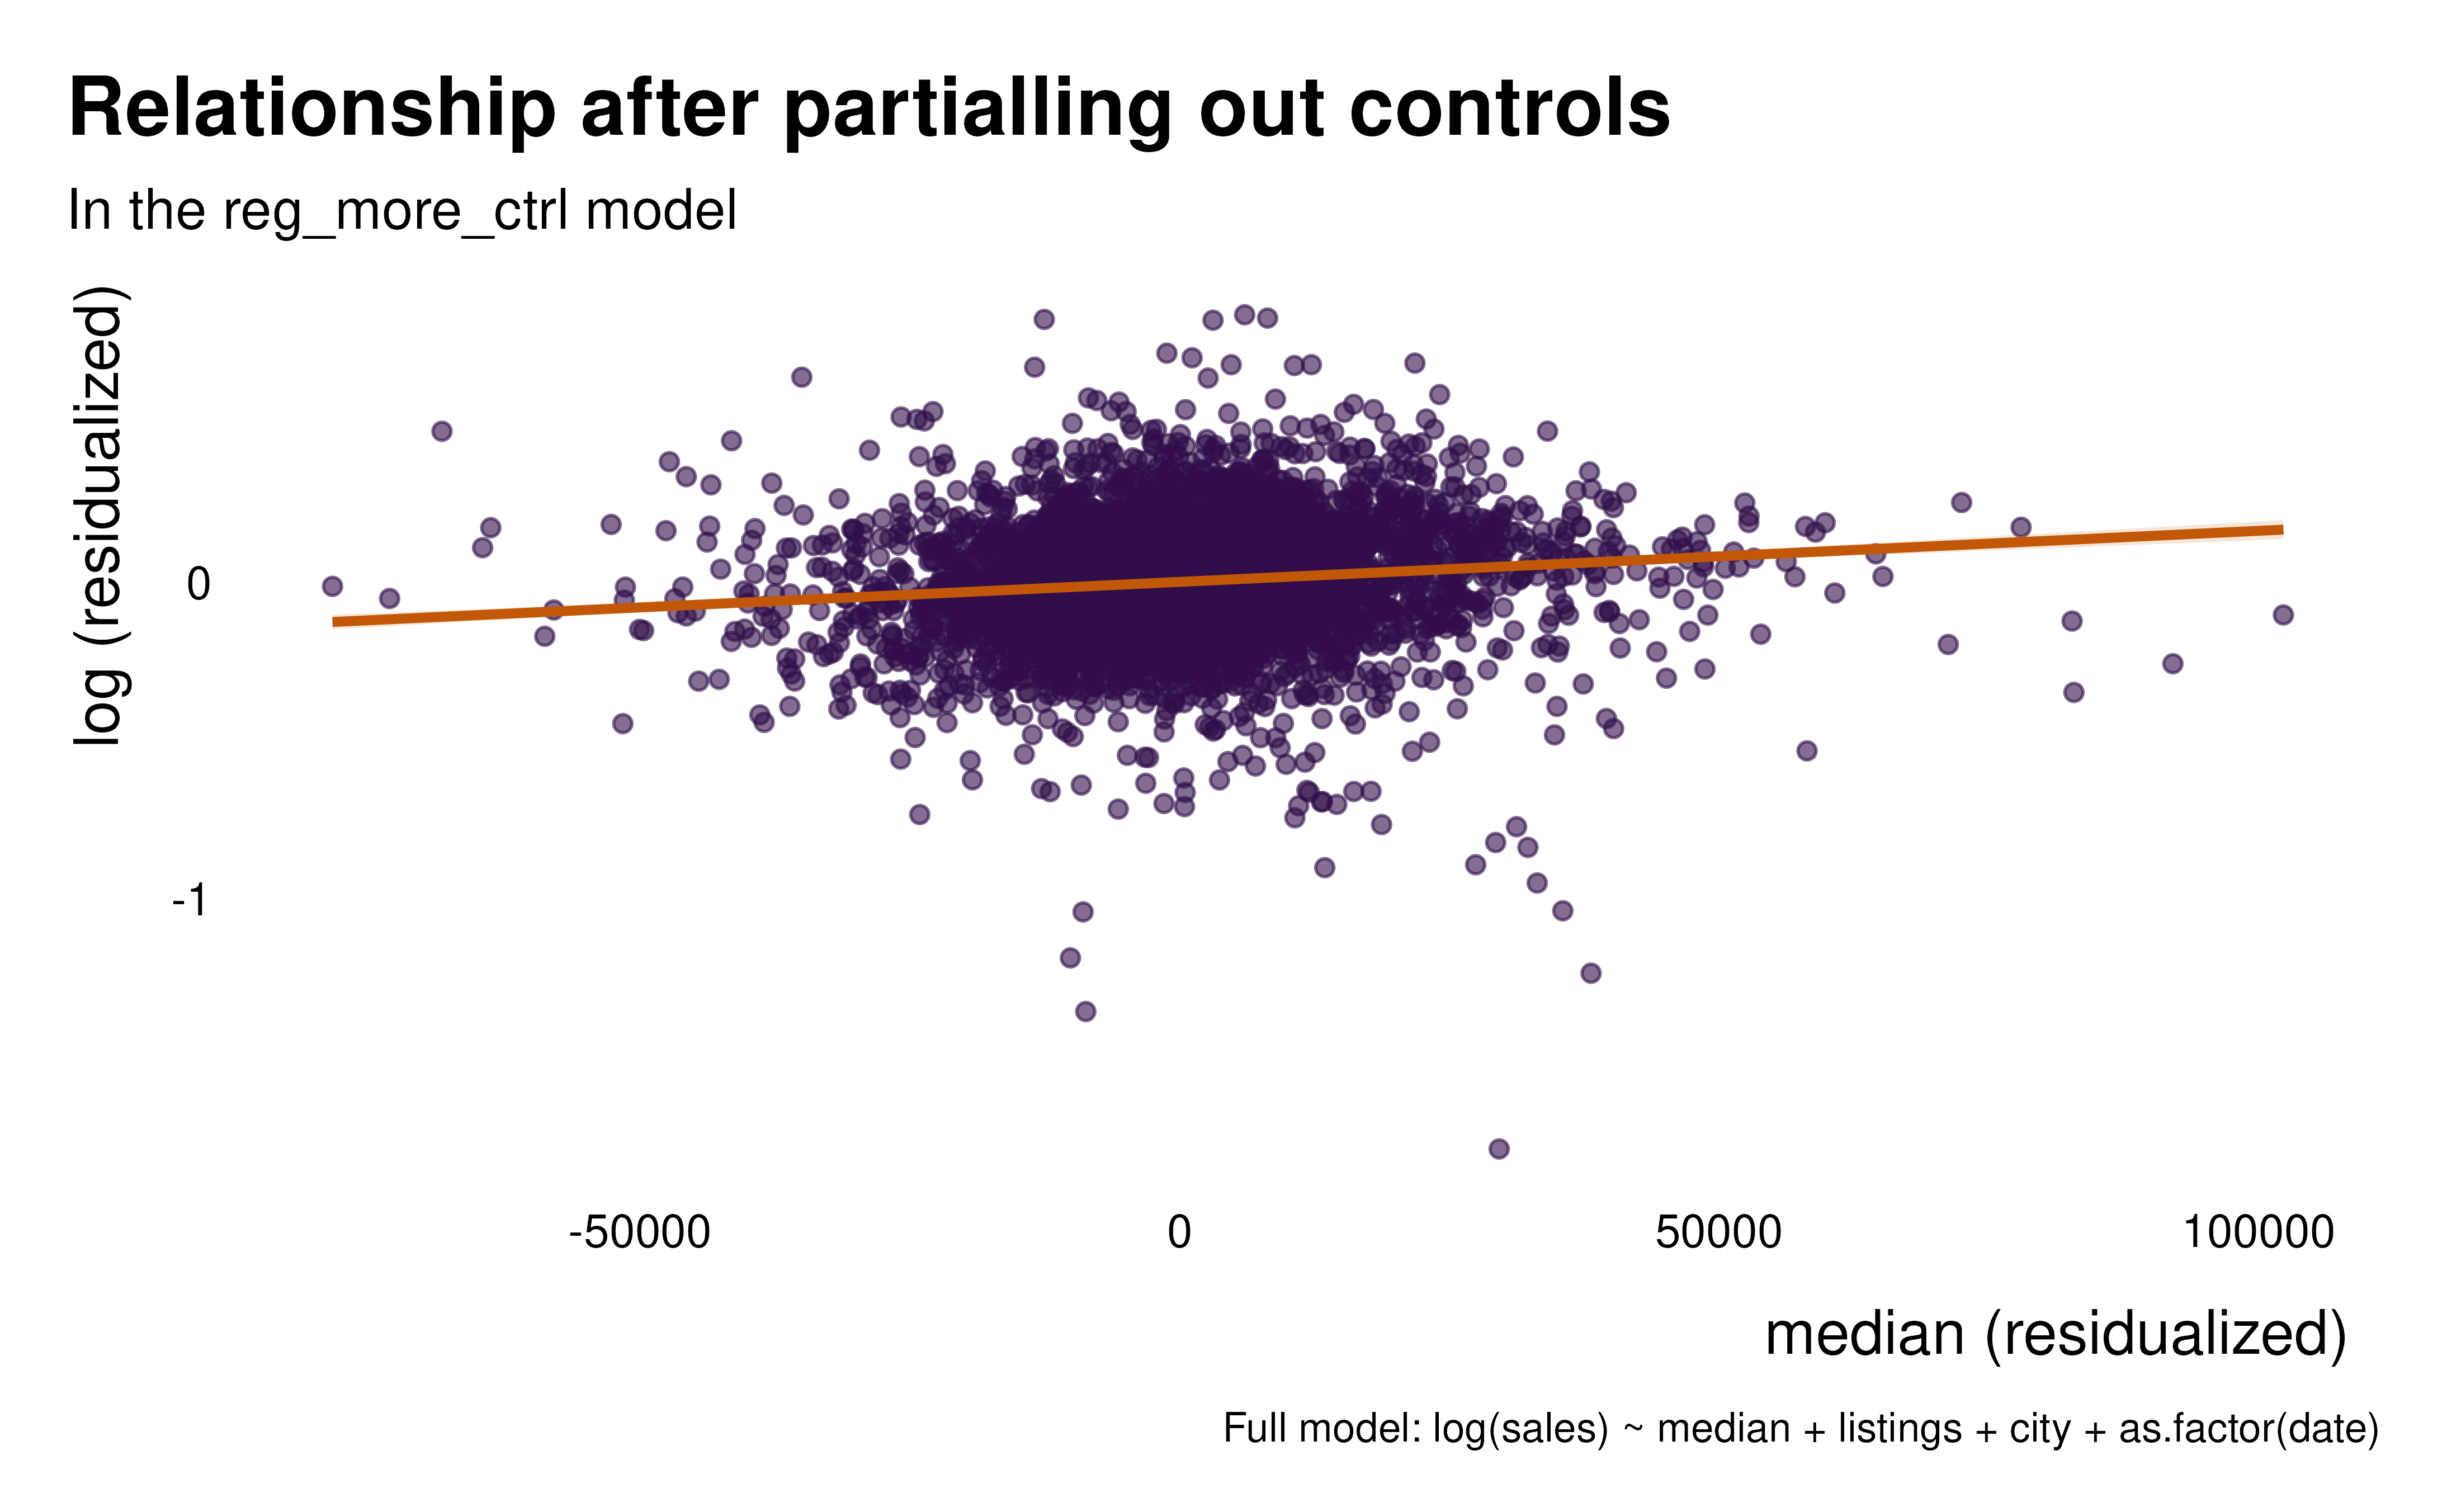
 reg_more_ctrl <- ggplot2::txhousing |>
lm(formula = log(sales) ~ median + listings + city + as.factor(date))
idid_viz_bivar(reg_more_ctrl, "median")
#> Warning: Removed 1434 rows containing non-finite outside the scale range
#> (`stat_smooth()`).
#> Warning: Removed 1434 rows containing missing values or values outside the scale range
#> (`geom_point()`).
reg_more_ctrl <- ggplot2::txhousing |>
lm(formula = log(sales) ~ median + listings + city + as.factor(date))
idid_viz_bivar(reg_more_ctrl, "median")
#> Warning: Removed 1434 rows containing non-finite outside the scale range
#> (`stat_smooth()`).
#> Warning: Removed 1434 rows containing missing values or values outside the scale range
#> (`geom_point()`).