Graph describing the evolution of the proportion of occurrences
gallicagraph_occur.RdTakes as input data produced by gallicagram or
gallicagram_lexicon and produces a graph
describing the evolution of the proportion of occurrences in this data set.
Arguments
- data
A data frame produced by the
gallicagramorgallicagram_lexiconfunctions (or several of such data frames bound by rows).- color
A variable to set colors for the graph
Value
A graph describing the evolution of the proportion of occurrences of one or several keywords in one or several corpora.
Details
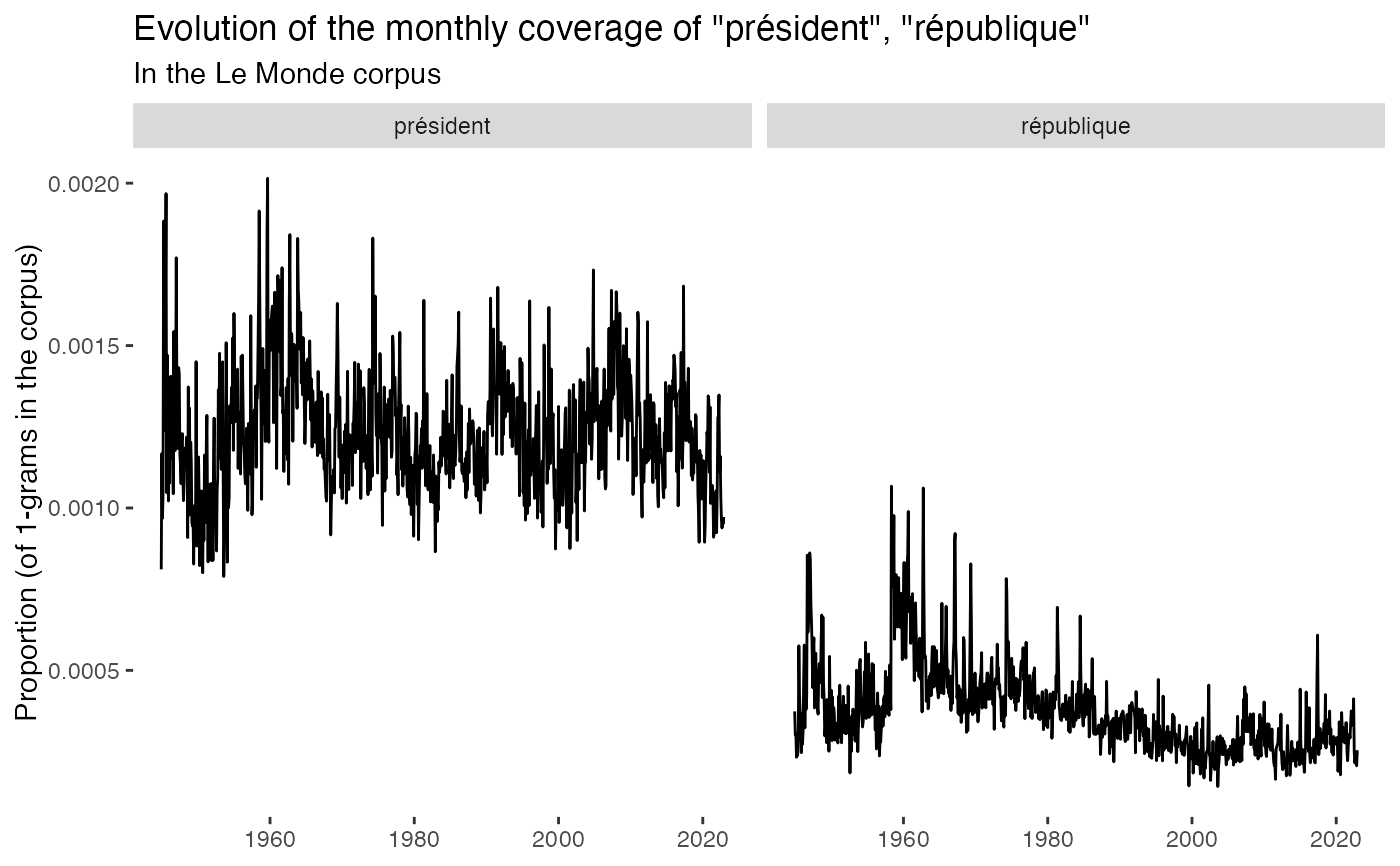
This function can also be combined with faceting by adding for instance
+ facet_wrap(~ keyword) after calling the function.
Examples
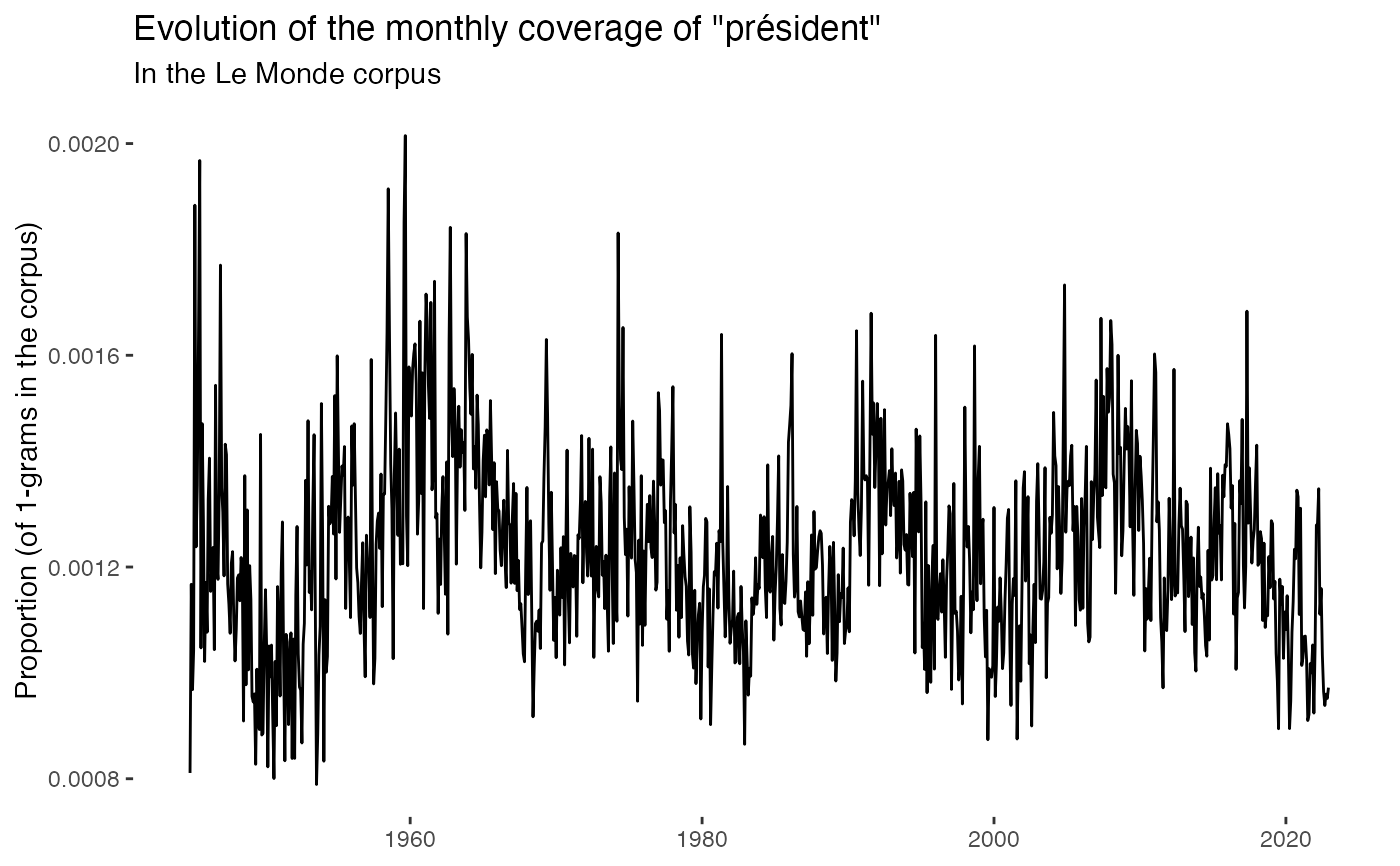
gallicagram("président") |>
gallicagraph_occur()
 gallicagram("président") |>
rbind(gallicagram("république")) |>
gallicagraph_occur(color = keyword)
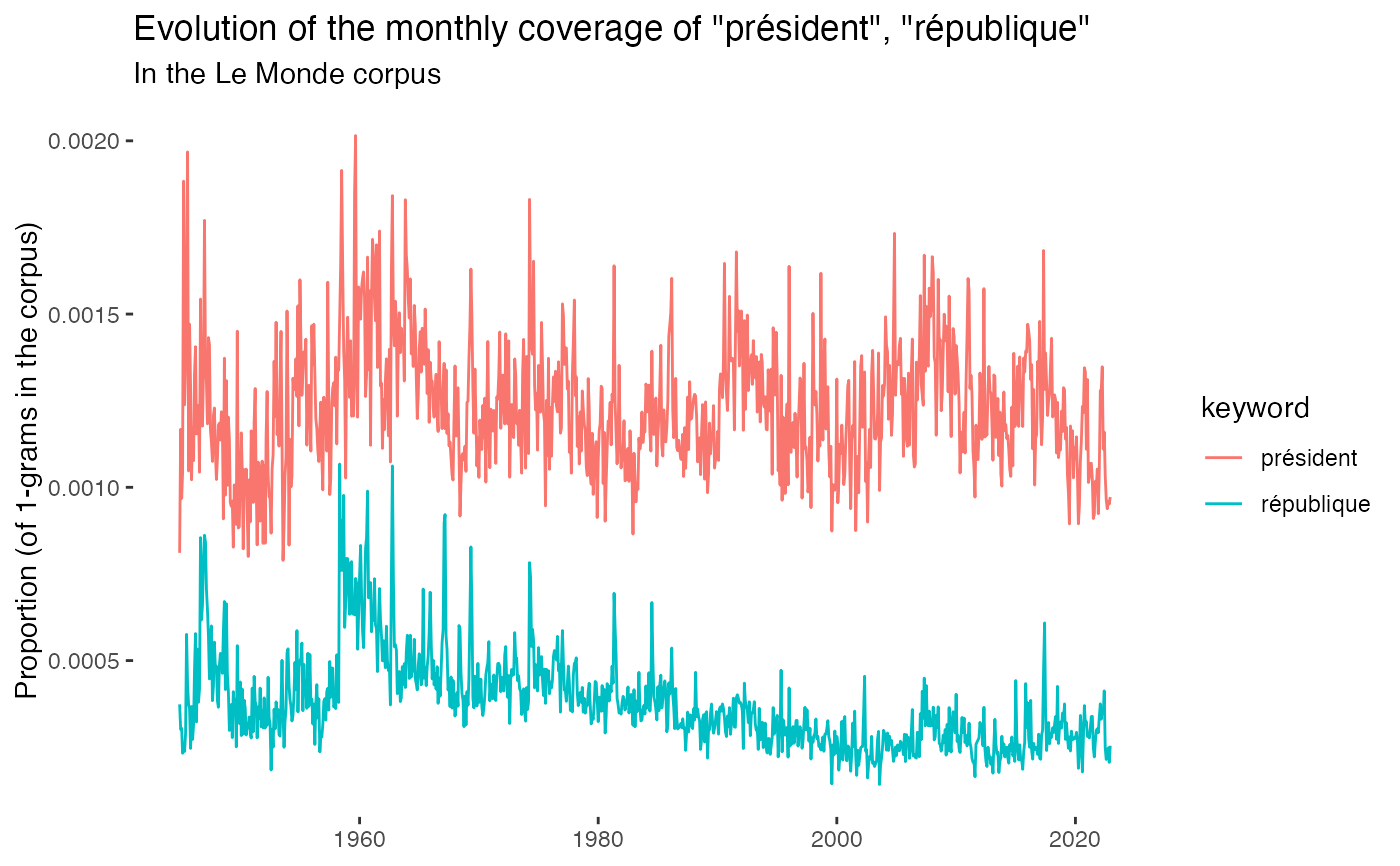
gallicagram("président") |>
rbind(gallicagram("république")) |>
gallicagraph_occur(color = keyword)
 gallicagram("président") |>
rbind(gallicagram("république")) |>
gallicagraph_occur() +
ggplot2::facet_wrap(~ keyword)
gallicagram("président") |>
rbind(gallicagram("république")) |>
gallicagraph_occur() +
ggplot2::facet_wrap(~ keyword)
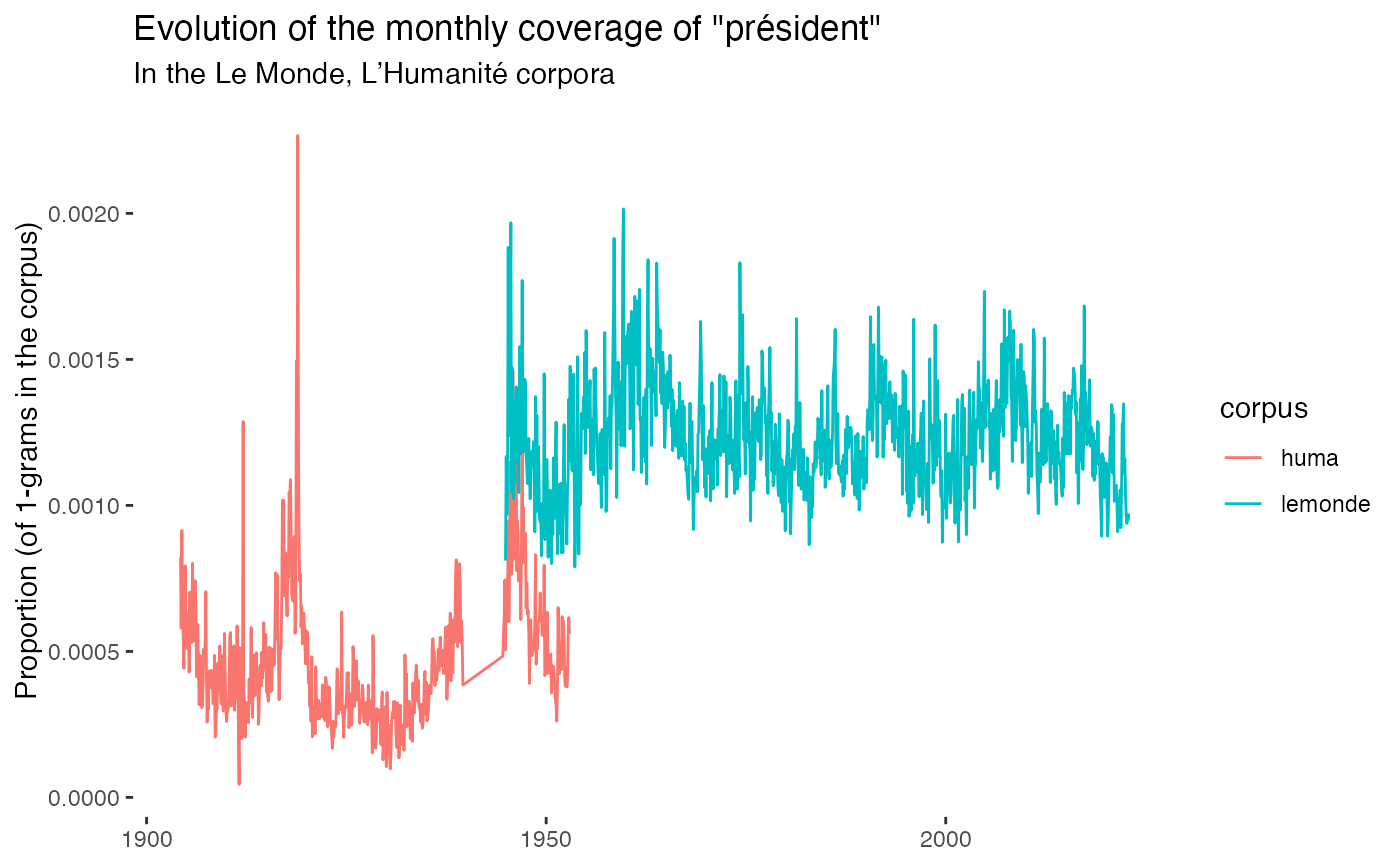
 gallicagram("président") |>
rbind(gallicagram("président", corpus = "huma")) |>
gallicagraph_occur(color = corpus)
gallicagram("président") |>
rbind(gallicagram("président", corpus = "huma")) |>
gallicagraph_occur(color = corpus)